Finding the Median in Datasets
Interactive Video
•
Mathematics
•
9th - 10th Grade
•
Practice Problem
•
Hard

Thomas White
FREE Resource
Read more
10 questions
Show all answers
1.
MULTIPLE CHOICE QUESTION
30 sec • 1 pt
Why is the median considered a better representation of data than the mean in the presence of outliers?
Because it is always higher than the mean.
Because it considers all data points equally.
Because it is easier to calculate.
Because it is not affected by extremely high or low values.
2.
MULTIPLE CHOICE QUESTION
30 sec • 1 pt
What is the first step in finding the median of a dataset with an odd number of values?
Find the range of the dataset.
Arrange the data in ascending order.
Arrange the data in descending order.
Calculate the mean of the dataset.
3.
MULTIPLE CHOICE QUESTION
30 sec • 1 pt
In a dataset with 9 values, which position will the median occupy?
4th position
5th position
7th position
6th position
4.
MULTIPLE CHOICE QUESTION
30 sec • 1 pt
How do you find the median in a dataset with an even number of values?
Use the first value as the median.
Select the lowest value.
Select the highest value.
Take the average of the two middle values.
5.
MULTIPLE CHOICE QUESTION
30 sec • 1 pt
If a dataset has 10 values, what is the position of the median?
5th position
6th position
10th position
5.5th position
6.
MULTIPLE CHOICE QUESTION
30 sec • 1 pt
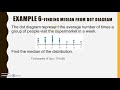
When finding the median from a dot diagram, what is the first step?
Count the total number of data points.
Select the highest frequency.
Choose the first data point.
Ignore the outliers.
7.
MULTIPLE CHOICE QUESTION
30 sec • 1 pt
In a frequency table, how do you determine the median position?
By finding the mode.
By selecting the first frequency.
By calculating the mean.
By summing the frequencies until reaching the middle value.
Access all questions and much more by creating a free account
Create resources
Host any resource
Get auto-graded reports
Continue with Google

Continue with Email
Continue with Classlink
Continue with Clever
or continue with
Microsoft
%20(1).png)
Apple
Others
Already have an account?
