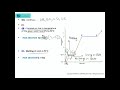
Heating Curves and Phase Changes
Interactive Video
•
Chemistry
•
9th - 10th Grade
•
Practice Problem
•
Hard

Patricia Brown
FREE Resource
Read more
10 questions
Show all answers
1.
MULTIPLE CHOICE QUESTION
30 sec • 1 pt
What is the main topic discussed in the video?
Chemical reactions
Phase changes and heating curves
Periodic table
Atomic structure
2.
MULTIPLE CHOICE QUESTION
30 sec • 1 pt
In a temperature-time graph, what does the y-axis represent?
Time
Volume
Pressure
Temperature
3.
MULTIPLE CHOICE QUESTION
30 sec • 1 pt
What phase does segment AB of the heating curve represent?
Solid
Liquid
Gas
Plasma
4.
MULTIPLE CHOICE QUESTION
30 sec • 1 pt
What process occurs during segment BC of the heating curve?
Melting
Sublimation
Condensation
Freezing
5.
MULTIPLE CHOICE QUESTION
30 sec • 1 pt
What is the formula for heat absorbed when there is no change in state?
Q = nRT
Q = PΔV
Q = mcΔT
Q = mL
6.
MULTIPLE CHOICE QUESTION
30 sec • 1 pt
During segment CD, what phase is the substance in?
Solid
Liquid
Gas
Plasma
7.
MULTIPLE CHOICE QUESTION
30 sec • 1 pt
What does segment DE of the heating curve represent?
Condensation
Melting
Boiling
Freezing
Access all questions and much more by creating a free account
Create resources
Host any resource
Get auto-graded reports
Continue with Google

Continue with Email
Continue with Classlink
Continue with Clever
or continue with
Microsoft
%20(1).png)
Apple
Others
Already have an account?
Popular Resources on Wayground

15 questions
Fractions on a Number Line
Quiz
•
3rd Grade
20 questions
Equivalent Fractions
Quiz
•
3rd Grade
25 questions
Multiplication Facts
Quiz
•
5th Grade
29 questions
Alg. 1 Section 5.1 Coordinate Plane
Quiz
•
9th Grade
22 questions
fractions
Quiz
•
3rd Grade
11 questions
FOREST Effective communication
Lesson
•
KG
20 questions
Main Idea and Details
Quiz
•
5th Grade
20 questions
Context Clues
Quiz
•
6th Grade
Discover more resources for Chemistry
22 questions
Unit 9 Gas Law Quiz
Quiz
•
10th Grade
10 questions
Exploring Types of Chemical Reactions
Interactive video
•
6th - 10th Grade
20 questions
Types of Chemical Reactions
Quiz
•
9th - 12th Grade
20 questions
Acids and Bases
Quiz
•
10th Grade
30 questions
Energy Review
Quiz
•
9th Grade
7 questions
GCSE Chemistry - Balancing Chemical Equations #4
Interactive video
•
9th - 10th Grade
20 questions
Chemistry: Classification of Matter
Quiz
•
10th Grade
40 questions
Unit 3 (Part 1) Chemical Equations & Reactions Review Game
Quiz
•
8th - 12th Grade