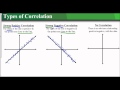
Understanding Correlation and Scatter Plots
Interactive Video
•
Mathematics
•
9th - 10th Grade
•
Practice Problem
•
Hard

Patricia Brown
FREE Resource
Read more
10 questions
Show all answers
1.
MULTIPLE CHOICE QUESTION
30 sec • 1 pt
What is the primary purpose of analyzing scatter plots?
To identify the maximum value in the dataset
To determine the color of data points
To find the correlation between two variables
To calculate the average of data points
2.
MULTIPLE CHOICE QUESTION
30 sec • 1 pt
Which of the following best describes a strong positive correlation?
Data points form a line with a positive slope
Data points are scattered randomly
Data points form a line with a negative slope
Data points form a circle
3.
MULTIPLE CHOICE QUESTION
30 sec • 1 pt
What does the 'strong' part in a strong positive correlation refer to?
The number of data points
The closeness of data points to the line
The size of the data points
The color of the line
4.
MULTIPLE CHOICE QUESTION
30 sec • 1 pt
How is a strong negative correlation identified?
Data points form a line with a negative slope
Data points form a line with a positive slope
Data points form a curve
Data points are scattered randomly
5.
MULTIPLE CHOICE QUESTION
30 sec • 1 pt
In a strong negative correlation, what does the 'negative' part refer to?
The size of the data points
The number of data points
The direction of the slope
The color of the line
6.
MULTIPLE CHOICE QUESTION
30 sec • 1 pt
What characterizes a dataset with no correlation?
Data points form a line with a positive slope
Data points form a line with a negative slope
Data points are randomly scattered
Data points form a curve
7.
MULTIPLE CHOICE QUESTION
30 sec • 1 pt
Which of the following is true about a dataset with no correlation?
A clear line can be drawn through the data points
Data points form a perfect circle
There is no obvious relationship between the data points
Data points form a line with a positive slope
Access all questions and much more by creating a free account
Create resources
Host any resource
Get auto-graded reports
Continue with Google

Continue with Email
Continue with Classlink
Continue with Clever
or continue with
Microsoft
%20(1).png)
Apple
Others
Already have an account?
Popular Resources on Wayground

15 questions
Fractions on a Number Line
Quiz
•
3rd Grade
20 questions
Equivalent Fractions
Quiz
•
3rd Grade
25 questions
Multiplication Facts
Quiz
•
5th Grade
29 questions
Alg. 1 Section 5.1 Coordinate Plane
Quiz
•
9th Grade
22 questions
fractions
Quiz
•
3rd Grade
11 questions
FOREST Effective communication
Lesson
•
KG
20 questions
Main Idea and Details
Quiz
•
5th Grade
20 questions
Context Clues
Quiz
•
6th Grade
Discover more resources for Mathematics
29 questions
Alg. 1 Section 5.1 Coordinate Plane
Quiz
•
9th Grade
20 questions
Graphing Inequalities on a Number Line
Quiz
•
6th - 9th Grade
20 questions
Box and Whisker Plots
Quiz
•
9th Grade
18 questions
Exponential Growth and Decay
Quiz
•
9th Grade
20 questions
Function or Not a Function
Quiz
•
8th - 9th Grade
20 questions
SSS/SAS
Quiz
•
9th - 12th Grade
14 questions
Making Inferences From Samples
Quiz
•
7th - 12th Grade
23 questions
CCG - CH8 Polygon angles and area Review
Quiz
•
9th - 12th Grade