Understanding Tally Charts and Frequencies
Interactive Video
•
Mathematics
•
3rd - 4th Grade
•
Practice Problem
•
Hard

Patricia Brown
FREE Resource
Read more
10 questions
Show all answers
1.
MULTIPLE CHOICE QUESTION
30 sec • 1 pt
What is the primary purpose of a tally chart?
To organize and collect data
To create a pie chart
To display data in a bar graph
To calculate averages
2.
MULTIPLE CHOICE QUESTION
30 sec • 1 pt
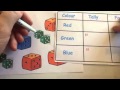
Which colors were used in the example tally chart?
Red, Yellow, Blue
Blue, Red, Yellow
Red, Green, Blue
Green, Blue, Yellow
3.
MULTIPLE CHOICE QUESTION
30 sec • 1 pt
What is the first step in adding data to a tally chart?
Add all data at once
Do it systematically, one piece at a time
Use a calculator
Estimate the data
4.
MULTIPLE CHOICE QUESTION
30 sec • 1 pt
What should you do after adding each piece of data to the tally chart?
Cross it off
Erase the data
Highlight the data
Underline the data
5.
MULTIPLE CHOICE QUESTION
30 sec • 1 pt
Why is it important to be systematic when filling out a tally chart?
To make it colorful
To impress others
To ensure accuracy
To save time
6.
MULTIPLE CHOICE QUESTION
30 sec • 1 pt
How should you mark the fifth tally in a group?
With a circle
With a diagonal line
With a star
With a square
7.
MULTIPLE CHOICE QUESTION
30 sec • 1 pt
What is the frequency of the color red in the example?
Three
Four
Five
Six
Access all questions and much more by creating a free account
Create resources
Host any resource
Get auto-graded reports
Continue with Google

Continue with Email
Continue with Microsoft
or continue with

%20(1).png)
Apple
Others
Already have an account?
