Understanding Sample Proportions and Distributions
Interactive Video
•
Mathematics
•
9th - 10th Grade
•
Practice Problem
•
Medium

Thomas White
Used 1+ times
FREE Resource
Read more
10 questions
Show all answers
1.
MULTIPLE CHOICE QUESTION
30 sec • 1 pt
Why is it impractical to measure the proportion of left-handed people in the entire population?
Because it requires special equipment.
Because the population is too large.
Because left-handedness is not well-defined.
Because left-handed people are rare.
2.
MULTIPLE CHOICE QUESTION
30 sec • 1 pt
How do you calculate the sample proportion from a sample?
By adding the number of left-handed people to the sample size.
By dividing the number of left-handed people by the sample size.
By multiplying the number of left-handed people by the sample size.
By dividing the total population by the sample size.
3.
MULTIPLE CHOICE QUESTION
30 sec • 1 pt
What does a sample proportion of 0.15 indicate?
15% of the sample is left-handed.
15% of the population is left-handed.
The sample size is 15.
The population size is 15.
4.
MULTIPLE CHOICE QUESTION
30 sec • 1 pt
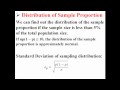
Under what condition is the distribution of the sample proportion approximately normal?
When the sample size is more than 10% of the population.
When the sample size is less than 5% of the population.
When n * p * (1-p) is less than 10.
When n * p * (1-p) is greater than 10.
5.
MULTIPLE CHOICE QUESTION
30 sec • 1 pt
What is the significance of the equation n * p * (1-p) > 10?
It confirms the sample proportion is exactly 0.5.
It ensures the sample size is adequate.
It shows the sample is biased.
It indicates the distribution is approximately normal.
6.
MULTIPLE CHOICE QUESTION
30 sec • 1 pt
How is the standard deviation of a sampling distribution calculated?
By using the equation n * p * (1-p).
By subtracting the mean from the sample size.
By dividing the sample size by the population size.
By using a specific equation involving n and p.
7.
MULTIPLE CHOICE QUESTION
30 sec • 1 pt
What are the mean and standard deviation used for in constructing a distribution?
To determine the sample size.
To draw a normal distribution curve.
To calculate the population size.
To find the number of left-handed people.
Access all questions and much more by creating a free account
Create resources
Host any resource
Get auto-graded reports
Continue with Google

Continue with Email
Continue with Classlink
Continue with Clever
or continue with
Microsoft
%20(1).png)
Apple
Others
Already have an account?
