Understanding Checking Account Graphs
Interactive Video
•
Mathematics
•
9th - 10th Grade
•
Practice Problem
•
Hard

Aiden Montgomery
FREE Resource
Read more
6 questions
Show all answers
1.
MULTIPLE CHOICE QUESTION
30 sec • 1 pt
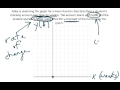
What does the x-axis represent in the context of the student's checking account graph?
The amount of money in the account
The number of weeks
The interest rate
The number of transactions
2.
MULTIPLE CHOICE QUESTION
30 sec • 1 pt
How much money does the student start with in their checking account?
$200
$250
$150
$100
3.
MULTIPLE CHOICE QUESTION
30 sec • 1 pt
What is the y-intercept in the context of this graph?
The total amount of money after 10 weeks
The point where the graph crosses the x-axis
The starting amount of money in the account
The rate at which money is spent
4.
MULTIPLE CHOICE QUESTION
30 sec • 1 pt
Where does the graph touch the y-axis?
At $100
At $0
At $300
At $200
5.
MULTIPLE CHOICE QUESTION
30 sec • 1 pt
What does the $20 per week represent in the linear function?
The rate of change
The constant
The total amount
The y-intercept
6.
MULTIPLE CHOICE QUESTION
30 sec • 1 pt
How is the graph plotted using the given values?
By marking every $100 increment
By marking every $50 increment
By marking every $20 increment
By marking every $10 increment
Access all questions and much more by creating a free account
Create resources
Host any resource
Get auto-graded reports
Continue with Google

Continue with Email
Continue with Classlink
Continue with Clever
or continue with
Microsoft
%20(1).png)
Apple
Others
Already have an account?
Popular Resources on Wayground

15 questions
Fractions on a Number Line
Quiz
•
3rd Grade
20 questions
Equivalent Fractions
Quiz
•
3rd Grade
25 questions
Multiplication Facts
Quiz
•
5th Grade
54 questions
Analyzing Line Graphs & Tables
Quiz
•
4th Grade
22 questions
fractions
Quiz
•
3rd Grade
20 questions
Main Idea and Details
Quiz
•
5th Grade
20 questions
Context Clues
Quiz
•
6th Grade
15 questions
Equivalent Fractions
Quiz
•
4th Grade
Discover more resources for Mathematics
20 questions
Graphing Inequalities on a Number Line
Quiz
•
6th - 9th Grade
18 questions
SAT Prep: Ratios, Proportions, & Percents
Quiz
•
9th - 10th Grade
12 questions
Exponential Growth and Decay
Quiz
•
9th Grade
12 questions
Parallel Lines Cut by a Transversal
Quiz
•
10th Grade
12 questions
Add and Subtract Polynomials
Quiz
•
9th - 12th Grade
15 questions
Combine Like Terms and Distributive Property
Quiz
•
8th - 9th Grade
20 questions
Function or Not a Function
Quiz
•
8th - 9th Grade
10 questions
Elijah McCoy: Innovations and Impact in Black History
Interactive video
•
6th - 10th Grade