Understanding Rate of Change in Graphs
Interactive Video
•
Mathematics
•
9th - 10th Grade
•
Practice Problem
•
Hard

Mia Campbell
FREE Resource
Read more
9 questions
Show all answers
1.
MULTIPLE CHOICE QUESTION
30 sec • 1 pt
What does the term 'rate of change' refer to in the context of a graph?
The height of the graph
The width of the graph
The slope of the graph
The color of the graph
2.
MULTIPLE CHOICE QUESTION
30 sec • 1 pt
How can you identify a constant rate of change on a graph?
The graph is a horizontal line
The graph is a vertical line
The graph has a consistent slope
The graph is a curve
3.
MULTIPLE CHOICE QUESTION
30 sec • 1 pt
Which of the following is true about a graph with a constant rate of change?
The slope varies at different points
The slope is zero
The slope is negative
The slope remains the same throughout
4.
MULTIPLE CHOICE QUESTION
30 sec • 1 pt
What type of graph represents an increasing rate of change?
Linear graph
Quadratic graph
Circular graph
Exponential graph
5.
MULTIPLE CHOICE QUESTION
30 sec • 1 pt
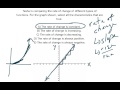
Why is the rate of change not considered increasing in the given graph?
Because the graph is a straight line
Because the graph is a curve
Because the graph is vertical
Because the graph is horizontal
6.
MULTIPLE CHOICE QUESTION
30 sec • 1 pt
Which option correctly describes a graph with a decreasing rate of change?
The slope becomes more steep over time
The slope is zero
The slope becomes less steep over time
The slope remains constant
7.
MULTIPLE CHOICE QUESTION
30 sec • 1 pt
What does it mean if the rate of change is always positive?
The graph moves downwards
The graph moves left
The graph moves upwards
The graph remains flat
Access all questions and much more by creating a free account
Create resources
Host any resource
Get auto-graded reports
Continue with Google

Continue with Email
Continue with Classlink
Continue with Clever
or continue with
Microsoft
%20(1).png)
Apple
Others
Already have an account?
