Chicken Egg Production Analysis
Interactive Video
•
Mathematics
•
9th - 10th Grade
•
Practice Problem
•
Hard

Lucas Foster
FREE Resource
Read more
7 questions
Show all answers
1.
MULTIPLE CHOICE QUESTION
30 sec • 1 pt
What is the main question being addressed in the video?
Predicting the number of eggs laid by a ten-year-old chicken
How to draw a scatterplot
Understanding chicken behavior
Calculating the lifespan of a chicken
2.
MULTIPLE CHOICE QUESTION
30 sec • 1 pt
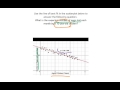
What does the x-axis represent in the scatterplot?
Time in months
Age of the chicken
Weight of the chicken
Number of eggs laid
3.
MULTIPLE CHOICE QUESTION
30 sec • 1 pt
What is the purpose of the line of best fit in the scatterplot?
To show the average weight of chickens
To connect all data points
To predict future values
To highlight the oldest chicken
4.
MULTIPLE CHOICE QUESTION
30 sec • 1 pt
What is the equation used for the line of best fit?
y = 3x - 30
y = -3x + 30
y = -3x - 30
y = 3x + 30
5.
MULTIPLE CHOICE QUESTION
30 sec • 1 pt
How is the x-value determined for the calculation?
By the number of eggs laid
By the time of the year
By the age of the chicken
By the weight of the chicken
6.
MULTIPLE CHOICE QUESTION
30 sec • 1 pt
What is the expected number of eggs laid by a ten-year-old chicken according to the calculation?
50 eggs
0 eggs
30 eggs
10 eggs
7.
MULTIPLE CHOICE QUESTION
30 sec • 1 pt
What conclusion is drawn from the calculation?
A ten-year-old chicken lays 50 eggs
A ten-year-old chicken lays 0 eggs
A ten-year-old chicken lays 30 eggs
A ten-year-old chicken lays 10 eggs
Access all questions and much more by creating a free account
Create resources
Host any resource
Get auto-graded reports
Continue with Google

Continue with Email
Continue with Classlink
Continue with Clever
or continue with
Microsoft
%20(1).png)
Apple
Others
Already have an account?
