Residual Plots and Model Fit
Interactive Video
•
Mathematics
•
9th - 10th Grade
•
Practice Problem
•
Hard

Lucas Foster
FREE Resource
Read more
9 questions
Show all answers
1.
MULTIPLE CHOICE QUESTION
30 sec • 1 pt
What is the primary purpose of a residual plot in the context of linear models?
To determine the slope of the line of best fit
To assess the distribution of residuals for model fit
To calculate the mean of the data points
To identify outliers in the data set
2.
MULTIPLE CHOICE QUESTION
30 sec • 1 pt
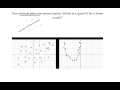
What does a residual plot with randomly distributed points suggest about the model?
The model is a poor fit
The model is a good fit for a logarithmic relationship
The model is a good fit for a linear relationship
The model is a good fit for a quadratic relationship
3.
MULTIPLE CHOICE QUESTION
30 sec • 1 pt
In a residual plot, what does it mean if some points are above and some are below the line of best fit?
The model is not suitable
The residuals are not calculated correctly
The points are randomly distributed
The model is a perfect fit
4.
MULTIPLE CHOICE QUESTION
30 sec • 1 pt
Why is a random distribution of residuals important in a linear model?
It confirms the model's assumptions are met
It shows the data is non-linear
It suggests the model is overfitting
It indicates a poor fit
5.
MULTIPLE CHOICE QUESTION
30 sec • 1 pt
What does a U-shaped pattern in a residual plot indicate?
A random distribution of residuals
A perfect fit for a linear model
A poor fit for a linear model
A good fit for a linear model
6.
MULTIPLE CHOICE QUESTION
30 sec • 1 pt
Which type of model might be more appropriate if a residual plot shows a U-shaped pattern?
Linear model
Exponential model
Logarithmic model
Quadratic model
7.
MULTIPLE CHOICE QUESTION
30 sec • 1 pt
What does it mean if residuals are not randomly distributed?
The data is perfectly linear
The residuals are incorrect
The model is a poor fit
The model is a good fit
Access all questions and much more by creating a free account
Create resources
Host any resource
Get auto-graded reports
Continue with Google

Continue with Email
Continue with Microsoft
or continue with

%20(1).png)
Apple
Others
Already have an account?
