Data Set Skewness and Symmetry
Interactive Video
•
Mathematics
•
9th - 10th Grade
•
Practice Problem
•
Hard

Lucas Foster
FREE Resource
Read more
7 questions
Show all answers
1.
MULTIPLE CHOICE QUESTION
30 sec • 1 pt
What is the primary focus when describing the shape of a data set?
The type of data used
The distribution and symmetry of the data
The size of the data set
The color of the data points
2.
MULTIPLE CHOICE QUESTION
30 sec • 1 pt
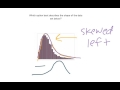
When a data set is skewed to the left, where is most of the data concentrated?
On the left side
Evenly distributed
In the center
On the right side
3.
MULTIPLE CHOICE QUESTION
30 sec • 1 pt
What happens to the data on the right side when a data set is skewed to the left?
It shifts to the left
It remains symmetrical
It tapers off
It becomes more concentrated
4.
MULTIPLE CHOICE QUESTION
30 sec • 1 pt
In a right-skewed data set, where is the majority of the data located?
On the left side
In the center
On the right side
Evenly distributed
5.
MULTIPLE CHOICE QUESTION
30 sec • 1 pt
What is a key characteristic of a symmetrical data set?
Data is skewed to the left
Data is evenly distributed
Data is concentrated on one side
Data is skewed to the right
6.
MULTIPLE CHOICE QUESTION
30 sec • 1 pt
How can you easily identify if a data set is symmetrical?
By checking if it is skewed to the left
By checking if it is skewed to the right
By observing if it is evenly distributed
By counting the data points
7.
MULTIPLE CHOICE QUESTION
30 sec • 1 pt
What should you pay attention to when determining the direction of skewness in a data set?
The number of data points
The type of data
The hump in the data
The color of the data
Access all questions and much more by creating a free account
Create resources
Host any resource
Get auto-graded reports
Continue with Google

Continue with Email
Continue with Microsoft
or continue with

%20(1).png)
Apple
Others
Already have an account?
