Understanding Line of Best Fit
Interactive Video
•
Mathematics
•
9th - 10th Grade
•
Practice Problem
•
Hard

Lucas Foster
FREE Resource
Read more
5 questions
Show all answers
1.
MULTIPLE CHOICE QUESTION
30 sec • 1 pt
What is the purpose of fitting a line of best fit to a scatter plot?
To find the exact values of all data points
To identify the trend in the data
To eliminate outliers from the data
To create a histogram of the data
2.
MULTIPLE CHOICE QUESTION
30 sec • 1 pt
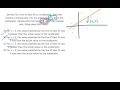
In the context of the video, what does the point (3, 2) represent?
An actual data point on the scatter plot
A midpoint of the data set
An outlier in the data set
A predicted value on the line of best fit
3.
MULTIPLE CHOICE QUESTION
30 sec • 1 pt
What does a residual value of -4 indicate about the actual point in relation to the line of best fit?
The actual point is 4 units to the right of the line of best fit
The actual point is exactly on the line of best fit
The actual point is 4 units below the line of best fit
The actual point is 4 units above the line of best fit
4.
MULTIPLE CHOICE QUESTION
30 sec • 1 pt
Why is the answer choice 'for x = 2' incorrect in the context of the video?
Because x = 2 is an outlier
Because x = 2 is not a valid data point
Because x = 2 is not on the scatter plot
Because the video is discussing x = 3
5.
MULTIPLE CHOICE QUESTION
30 sec • 1 pt
What does the correct answer choice indicate about the line of best fit?
It is 4 units to the left of the actual value
It is 4 units above the actual value
It is equal to the actual value
It is 4 units below the actual value
Access all questions and much more by creating a free account
Create resources
Host any resource
Get auto-graded reports
Continue with Google

Continue with Email
Continue with Microsoft
or continue with

%20(1).png)
Apple
Others
Already have an account?
