Estimating Ice Cream Sales
Interactive Video
•
Mathematics
•
9th - 10th Grade
•
Practice Problem
•
Hard

Lucas Foster
FREE Resource
Read more
7 questions
Show all answers
1.
MULTIPLE CHOICE QUESTION
30 sec • 1 pt
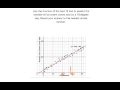
What is the purpose of using the best fit line in this context?
To find the average temperature over a week.
To predict the number of ice cream cones sold.
To calculate the total sales revenue.
To determine the exact temperature on a given day.
2.
MULTIPLE CHOICE QUESTION
30 sec • 1 pt
How many degrees does each tick mark represent on the plot?
2 degrees
5 degrees
10 degrees
15 degrees
3.
MULTIPLE CHOICE QUESTION
30 sec • 1 pt
Where is the 70° mark located on the plot?
Two tick marks after 50°
One tick mark before 75°
Directly at 75°
Three tick marks after 50°
4.
MULTIPLE CHOICE QUESTION
30 sec • 1 pt
What is the first step in finding the number of ice cream cones sold on a 70° day?
Identify the highest temperature on the plot.
Calculate the average temperature.
Locate the 70° mark on the plot.
Estimate the total sales revenue.
5.
MULTIPLE CHOICE QUESTION
30 sec • 1 pt
What is the estimated number of ice cream cones sold on a 70° day?
350 cones
250 cones
275 cones
300 cones
6.
MULTIPLE CHOICE QUESTION
30 sec • 1 pt
If the intersection point is slightly above halfway between 250 and 300, what is a reasonable estimate?
290 cones
280 cones
260 cones
270 cones
7.
MULTIPLE CHOICE QUESTION
30 sec • 1 pt
Which answer choice should you select if the intersection is closest to 275?
275 cones
325 cones
250 cones
300 cones
Access all questions and much more by creating a free account
Create resources
Host any resource
Get auto-graded reports
Continue with Google

Continue with Email
Continue with Classlink
Continue with Clever
or continue with
Microsoft
%20(1).png)
Apple
Others
Already have an account?
