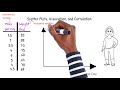
Scatter Plots and Correlation Concepts
Interactive Video
•
Mathematics
•
9th - 10th Grade
•
Practice Problem
•
Hard

Thomas White
FREE Resource
Read more
17 questions
Show all answers
1.
MULTIPLE CHOICE QUESTION
30 sec • 1 pt
What is the primary focus of this video?
Bar charts and their uses
Scatter plots, association, and correlation
Pie charts and data representation
Histograms and frequency distribution
2.
MULTIPLE CHOICE QUESTION
30 sec • 1 pt
How many women were surveyed in the study?
6
10
8
5
3.
MULTIPLE CHOICE QUESTION
30 sec • 1 pt
What is the weight of the woman who walks 3.5 miles per day?
73 kg
88 kg
83 kg
75 kg
4.
MULTIPLE CHOICE QUESTION
30 sec • 1 pt
Which variable is considered the explanatory variable in the study?
Height
Age
Number of miles walked per day
Weight
5.
MULTIPLE CHOICE QUESTION
30 sec • 1 pt
Where should the explanatory variable be placed on a scatter plot?
In the legend
On the x-axis
On the z-axis
On the y-axis
6.
MULTIPLE CHOICE QUESTION
30 sec • 1 pt
What does a cluster of points in the shape of a line on a scatter plot indicate?
Random distribution
A possible association
No association
A definite causation
7.
MULTIPLE CHOICE QUESTION
30 sec • 1 pt
What is a common misconception about correlation?
Correlation is the same as association
Correlation always means causation
Correlation never means causation
Correlation is unrelated to causation
Access all questions and much more by creating a free account
Create resources
Host any resource
Get auto-graded reports
Continue with Google

Continue with Email
Continue with Microsoft
or continue with

%20(1).png)
Apple
Others
Already have an account?
