- Resource Library
- Math
- Probability And Statistics
- Residual Plots
- Residual Analysis And Regression Concepts
Residual Analysis and Regression Concepts
Interactive Video
•
Mathematics
•
9th - 10th Grade
•
Practice Problem
•
Hard

Thomas White
FREE Resource
Read more
9 questions
Show all answers
1.
MULTIPLE CHOICE QUESTION
30 sec • 1 pt
What is the primary purpose of a residual plot?
To calculate the mean of the data
To display the original data points
To assess the fit of a regression model
To show the trend line
2.
MULTIPLE CHOICE QUESTION
30 sec • 1 pt
What does the equation y = 215x + 2.35 represent?
A scatter plot
A least squares regression line
A residual plot
A data table
3.
MULTIPLE CHOICE QUESTION
30 sec • 1 pt
How do you find the predicted y values for a residual plot?
By substituting x values into the regression equation
By using the original data points
By calculating the mean of y values
By drawing a trend line
4.
MULTIPLE CHOICE QUESTION
30 sec • 1 pt
What is the residual for the first data point if the actual y is 6 and the predicted y is 4.5?
3.5
0.5
2.5
1.5
5.
MULTIPLE CHOICE QUESTION
30 sec • 1 pt
Where is a negative residual plotted on a residual plot?
On the x-axis
Above the x-axis
Below the x-axis
On the y-axis
6.
MULTIPLE CHOICE QUESTION
30 sec • 1 pt
What does a random scatter of residuals around the x-axis indicate?
An error in data collection
A need for a nonlinear model
A good fit of the linear model
A poor fit of the model
7.
MULTIPLE CHOICE QUESTION
30 sec • 1 pt
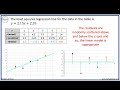
What is the least squares regression line for the new data set?
y = 1.5x + 2.25
y = 1.75x + 2.75
y = 2.15x + 3.5
y = 215x + 2.35
Access all questions and much more by creating a free account
Create resources
Host any resource
Get auto-graded reports
Continue with Google

Continue with Email
Continue with Microsoft
or continue with

%20(1).png)
Apple
Others
Already have an account?
