Data Interpretation and Frequency Analysis
Interactive Video
•
Mathematics
•
9th - 10th Grade
•
Practice Problem
•
Hard

Thomas White
FREE Resource
Read more
7 questions
Show all answers
1.
MULTIPLE CHOICE QUESTION
30 sec • 1 pt
What is the first step in completing the frequency table for the given data set?
Calculate the total number of potholes.
Count the occurrences of each number of potholes.
Convert frequencies to percentages.
Draw a bar graph.
2.
MULTIPLE CHOICE QUESTION
30 sec • 1 pt
How many 'ones' are there in the data set?
Eight
Twelve
Ten
Five
3.
MULTIPLE CHOICE QUESTION
30 sec • 1 pt
What is the relative frequency of 'twos' in the data set?
0.1143
0.1429
0.1714
0.2857
4.
MULTIPLE CHOICE QUESTION
30 sec • 1 pt
Why is it important to verify the sum of relative frequencies?
To ensure the data set is complete.
To confirm the calculations are correct.
To check if the data is normally distributed.
To identify any outliers in the data.
5.
MULTIPLE CHOICE QUESTION
30 sec • 1 pt
When interpreting a bar graph, what does the vertical axis represent if it shows numbers?
Relative frequency
Frequency
Cumulative frequency
Percentage
6.
MULTIPLE CHOICE QUESTION
30 sec • 1 pt
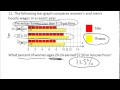
In the wage comparison bar graph, which color represents women?
Green
Yellow
Blue
Red
7.
MULTIPLE CHOICE QUESTION
30 sec • 1 pt
What is the purpose of using a back-to-back stem and leaf plot?
To display data in a pie chart.
To find the median of a data set.
To calculate the mean of a data set.
To compare two different data sets.
Access all questions and much more by creating a free account
Create resources
Host any resource
Get auto-graded reports
Continue with Google

Continue with Email
Continue with Microsoft
or continue with

%20(1).png)
Apple
Others
Already have an account?
