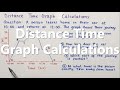
Distance-Time Graph Analysis
Interactive Video
•
Mathematics
•
9th - 10th Grade
•
Practice Problem
•
Hard

Thomas White
FREE Resource
Read more
13 questions
Show all answers
1.
MULTIPLE CHOICE QUESTION
30 sec • 1 pt
What is the main focus of the video tutorial?
Distance-time graph calculations
Velocity-time graph interpretation
Speed-time graph analysis
Acceleration-time graph study
2.
MULTIPLE CHOICE QUESTION
30 sec • 1 pt
What is represented on the y-axis of the distance-time graph?
Time in hours
Acceleration in m/s²
Distance in kilometers
Speed in km/h
3.
MULTIPLE CHOICE QUESTION
30 sec • 1 pt
How are the intervals on the x-axis of the graph divided?
Every 10 minutes
Every 30 minutes
Every 45 minutes
Every 15 minutes
4.
MULTIPLE CHOICE QUESTION
30 sec • 1 pt
What is the total distance traveled by the car?
24 kilometers
48 kilometers
72 kilometers
96 kilometers
5.
MULTIPLE CHOICE QUESTION
30 sec • 1 pt
At which points does the car reach its furthest distance from home?
Points F and G
Points D and E
Points C and D
Points A and B
6.
MULTIPLE CHOICE QUESTION
30 sec • 1 pt
How long does the car stop in total during the journey?
60 minutes
45 minutes
30 minutes
15 minutes
7.
MULTIPLE CHOICE QUESTION
30 sec • 1 pt
Which section of the graph indicates the car is stationary?
A sloped line
A vertical line
A horizontal line
A curved line
Access all questions and much more by creating a free account
Create resources
Host any resource
Get auto-graded reports
Continue with Google

Continue with Email
Continue with Microsoft
or continue with

%20(1).png)
Apple
Others
Already have an account?
