- Resource Library
- Math
- Probability And Statistics
- Cumulative Frequency
- Frequency Polygons And Cumulative Frequency
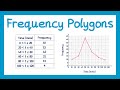
Frequency Polygons and Cumulative Frequency
Interactive Video
•
Mathematics
•
9th - 10th Grade
•
Practice Problem
•
Hard

Thomas White
FREE Resource
Read more
8 questions
Show all answers
1.
MULTIPLE CHOICE QUESTION
30 sec • 1 pt
Which exam boards do not assess frequency polygons?
All exam boards assess it
OCR and Edexcel
Edexcel and AQA
AQA and OCR
2.
MULTIPLE CHOICE QUESTION
30 sec • 1 pt
Where should you plot the points for a frequency polygon?
At the start of each interval
Randomly on the axis
At the midpoints of each interval
At the end of each interval
3.
MULTIPLE CHOICE QUESTION
30 sec • 1 pt
What is the midpoint for the interval 20 to 40?
30
25
40
20
4.
MULTIPLE CHOICE QUESTION
30 sec • 1 pt
What is a common mistake when drawing frequency polygons?
Using different colors
Plotting at the endpoints
Using curved lines
Connecting the first and last points
5.
MULTIPLE CHOICE QUESTION
30 sec • 1 pt
What does 'Poly the Shark' help you remember?
The axis labels
The frequency values
The midpoint plotting method
The shape of the polygon
6.
MULTIPLE CHOICE QUESTION
30 sec • 1 pt
How does a cumulative frequency diagram differ from a frequency polygon?
It uses bars
It always increases
It looks like a shark fin
It uses midpoints
7.
MULTIPLE CHOICE QUESTION
30 sec • 1 pt
In the second example, what is the frequency for the midpoint 15?
40
38
22
70
Access all questions and much more by creating a free account
Create resources
Host any resource
Get auto-graded reports
Continue with Google

Continue with Email
Continue with Microsoft
or continue with

%20(1).png)
Apple
Others
Already have an account?
