Measures of Central Tendency
Interactive Video
•
Mathematics
•
6th - 7th Grade
•
Practice Problem
•
Hard

Thomas White
FREE Resource
Read more
21 questions
Show all answers
1.
MULTIPLE CHOICE QUESTION
30 sec • 1 pt
What is the main focus of the video tutorial?
Explaining the concept of central tendency
Choosing the best measure of central tendency
Calculating the mean of a dataset
Understanding qualitative data
2.
MULTIPLE CHOICE QUESTION
30 sec • 1 pt
Why is it important to justify the choice of central tendency measure?
To understand data characteristics
To simplify calculations
To follow mathematical rules
To ensure accuracy
3.
MULTIPLE CHOICE QUESTION
30 sec • 1 pt
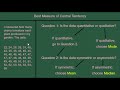
Which question helps determine if mode should be used?
Is the data quantitative or qualitative?
Is the data symmetric or asymmetric?
Is the data normally distributed?
Is the data skewed?
4.
MULTIPLE CHOICE QUESTION
30 sec • 1 pt
Which measure of central tendency is not suitable for quantitative data?
Mean
Median
Mode
All are suitable
5.
MULTIPLE CHOICE QUESTION
30 sec • 1 pt
What does the term 'quantitative data' refer to?
Data that is descriptive
Data that is numerical
Data that is categorical
Data that is qualitative
6.
MULTIPLE CHOICE QUESTION
30 sec • 1 pt
What is the role of the two key questions in the video?
To calculate the mean
To determine the best measure of central tendency
To assess data quality
To find the mode
7.
MULTIPLE CHOICE QUESTION
30 sec • 1 pt
What type of data is used in the cherry tomatoes example?
Qualitative and symmetric
Quantitative and symmetric
Quantitative and asymmetric
Qualitative and asymmetric
Access all questions and much more by creating a free account
Create resources
Host any resource
Get auto-graded reports
Continue with Google

Continue with Email
Continue with Microsoft
or continue with

%20(1).png)
Apple
Others
Already have an account?
