- Resource Library
- Math
- Probability And Statistics
- Frequency Tables
- Understanding Frequency Tables And Dot Plots
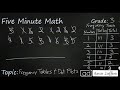
Understanding Frequency Tables and Dot Plots
Interactive Video
•
Mathematics
•
3rd - 5th Grade
•
Practice Problem
•
Hard

Thomas White
FREE Resource
Read more
27 questions
Show all answers
1.
MULTIPLE CHOICE QUESTION
30 sec • 1 pt
What is the main focus of the video tutorial?
Creating bar graphs
Understanding pie charts
Learning about line graphs
Creating data tables and dot plots
2.
MULTIPLE CHOICE QUESTION
30 sec • 1 pt
How many times was the die rolled in the example?
20 times
16 times
6 times
10 times
3.
MULTIPLE CHOICE QUESTION
30 sec • 1 pt
What is the purpose of using tally marks in a frequency table?
To make the table look neat
To easily count occurrences
To confuse the reader
To add more columns
4.
MULTIPLE CHOICE QUESTION
30 sec • 1 pt
How many columns are used in the frequency table example?
Two
Three
Four
One
5.
MULTIPLE CHOICE QUESTION
30 sec • 1 pt
What is the purpose of using tally marks in a frequency table?
To make the table look neat
To easily count occurrences
To confuse the reader
To add more columns
6.
MULTIPLE CHOICE QUESTION
30 sec • 1 pt
What is the next step after tallying in a frequency table?
Creating a bar graph
Adding more tally marks
Drawing a pie chart
Converting tallies to numerical form
7.
MULTIPLE CHOICE QUESTION
30 sec • 1 pt
How many times was the number '1' rolled according to the frequency table?
Three times
Four times
Two times
Five times
Access all questions and much more by creating a free account
Create resources
Host any resource
Get auto-graded reports
Continue with Google

Continue with Email
Continue with Microsoft
or continue with

%20(1).png)
Apple
Others
Already have an account?
