Understanding Line Graphs and Data Trends
Interactive Video
•
Mathematics
•
4th - 5th Grade
•
Practice Problem
•
Easy

Thomas White
Used 1+ times
FREE Resource
Read more
12 questions
Show all answers
1.
MULTIPLE CHOICE QUESTION
30 sec • 1 pt
What is the primary purpose of a line graph?
To show parts of a whole
To show static data
To compare different categories
To display data that changes over time
2.
MULTIPLE CHOICE QUESTION
30 sec • 1 pt
What do the dots on a line graph represent?
Axes
Trends
Categories
Data points
3.
MULTIPLE CHOICE QUESTION
30 sec • 1 pt
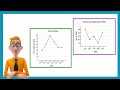
In the 'Movies Watched by Yap Family' graph, what does the x-axis represent?
Family members
Years
Genres
Number of movies
4.
MULTIPLE CHOICE QUESTION
30 sec • 1 pt
What does the y-axis show in the 'Movies Watched by Yap Family' graph?
Genres
Family members
Years
Number of movies
5.
MULTIPLE CHOICE QUESTION
30 sec • 1 pt
How do you determine the number of bicycles sold on a specific date in the 'Bicycle Sales' graph?
By checking the title
By moving up to the dot and then left to the y-axis
By counting the dots
By looking at the x-axis
6.
MULTIPLE CHOICE QUESTION
30 sec • 1 pt
On April 10, how many bicycles were sold according to the graph?
8
5
6
3
7.
MULTIPLE CHOICE QUESTION
30 sec • 1 pt
What is the significance of connecting dots with lines in a line graph?
To highlight the x-axis
To separate different data points
To show the trend of data
To make the graph look complete
Access all questions and much more by creating a free account
Create resources
Host any resource
Get auto-graded reports
Continue with Google

Continue with Email
Continue with Microsoft
or continue with

%20(1).png)
Apple
Others
Already have an account?
