Understanding Inequalities and Their Graphs
Interactive Video
•
Mathematics
•
6th - 7th Grade
•
Practice Problem
•
Hard

Thomas White
FREE Resource
Read more
15 questions
Show all answers
1.
MULTIPLE CHOICE QUESTION
30 sec • 1 pt
What is the main focus of the lesson on inequalities?
Learning to solve equations
Understanding the history of inequalities
Understanding what makes an inequality true
Exploring the use of variables in equations
2.
MULTIPLE CHOICE QUESTION
30 sec • 1 pt
Which symbol represents 'greater than or equal to'?
><
<>
>=
<=
3.
MULTIPLE CHOICE QUESTION
30 sec • 1 pt
How is 'X is greater than two' represented on a number line?
A shaded line including 2
A shaded line to the left of 2
A shaded line to the right of 2
A shaded circle at 2
4.
MULTIPLE CHOICE QUESTION
30 sec • 1 pt
What is the difference between 'X is greater than two' and 'X is greater than or equal to two' on a graph?
There is no difference
The line is shorter for 'greater than or equal to'
The line is longer for 'greater than or equal to'
The circle at 2 is shaded for 'greater than or equal to'
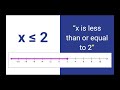
5.
MULTIPLE CHOICE QUESTION
30 sec • 1 pt
How is 'X is less than two' represented on a number line?
A shaded line including 2
A shaded circle at 2
A shaded line to the left of 2
A shaded line to the right of 2
6.
MULTIPLE CHOICE QUESTION
30 sec • 1 pt
What does shading the circle at the boundary point indicate?
The boundary point is included
The inequality is true
The boundary point is not included
The inequality is false
7.
MULTIPLE CHOICE QUESTION
30 sec • 1 pt
What is the most direct way to check if a value is a solution to an inequality?
Graphing the inequality
Substituting the value into the inequality
Guessing the solution
Using a calculator
Access all questions and much more by creating a free account
Create resources
Host any resource
Get auto-graded reports
Continue with Google

Continue with Email
Continue with Classlink
Continue with Clever
or continue with
Microsoft
%20(1).png)
Apple
Others
Already have an account?
