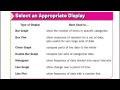
Types of Graphs and Their Uses
Interactive Video
•
Mathematics
•
6th - 7th Grade
•
Practice Problem
•
Hard

Thomas White
FREE Resource
Read more
20 questions
Show all answers
1.
MULTIPLE CHOICE QUESTION
30 sec • 1 pt
What is the key feature that distinguishes a histogram from a bar graph?
The height of the bars
The color of the bars
The width of the bars
The use of intervals
2.
MULTIPLE CHOICE QUESTION
30 sec • 1 pt
Which type of graph is best for showing the exact number of weeks a class collected between 30 and 39 pounds?
Circle graph
Bar graph
Line graph
Histogram
3.
MULTIPLE CHOICE QUESTION
30 sec • 1 pt
Which graph type is most suitable for displaying the percentage of time that 40 to 49 pounds of plastic was recycled?
Histogram
Circle graph
Line plot
Box plot
4.
MULTIPLE CHOICE QUESTION
30 sec • 1 pt
What does a bar graph typically show?
Parts of data compared to the whole
Number of items in specific categories
Frequency of data with a number line
Change over a period of time
5.
MULTIPLE CHOICE QUESTION
30 sec • 1 pt
Which graph type is useful for showing number variation in a large data set?
Double bar graph
Line graph
Box plot
Circle graph
6.
MULTIPLE CHOICE QUESTION
30 sec • 1 pt
What does a circle graph compare?
Change over a period of time
Frequency of data with a number line
Parts of data to the whole
Number of items in specific categories
7.
MULTIPLE CHOICE QUESTION
30 sec • 1 pt
Which graph type is best for comparing two sets of categorical data?
Line graph
Double bar graph
Circle graph
Histogram
Access all questions and much more by creating a free account
Create resources
Host any resource
Get auto-graded reports
Continue with Google

Continue with Email
Continue with Microsoft
or continue with

%20(1).png)
Apple
Others
Already have an account?
