Qualitative Graphs and Their Analysis
Interactive Video
•
Mathematics
•
6th - 7th Grade
•
Practice Problem
•
Hard

Thomas White
FREE Resource
Read more
7 questions
Show all answers
1.
MULTIPLE CHOICE QUESTION
30 sec • 1 pt
What is the main focus of today's lesson?
Understanding numerical graphs
Learning about statistical data
Solving algebraic equations
Analyzing and sketching qualitative graphs
2.
MULTIPLE CHOICE QUESTION
30 sec • 1 pt
What is a key characteristic of qualitative graphs?
They always include numerical values
They represent situations without numerical values
They are used for statistical analysis
They are only used in scientific research
3.
MULTIPLE CHOICE QUESTION
30 sec • 1 pt
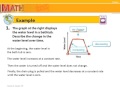
In the bathtub example, what happens to the water level when the water is turned off?
It increases
It decreases
It fluctuates
It remains constant
4.
MULTIPLE CHOICE QUESTION
30 sec • 1 pt
What is the purpose of sketching qualitative graphs?
To solve complex equations
To analyze statistical data
To represent essential elements of a situation graphically
To calculate exact values
5.
MULTIPLE CHOICE QUESTION
30 sec • 1 pt
In the tennis ball example, what happens to the height of each successive bounce?
It fluctuates randomly
It increases
It remains the same
It decreases
6.
MULTIPLE CHOICE QUESTION
30 sec • 1 pt
What does the graph of a child swinging on a swing illustrate?
The child swings higher each time
The child stops swinging immediately
The child reaches the ground
The child swings back and forth without touching the ground
7.
MULTIPLE CHOICE QUESTION
30 sec • 1 pt
What should students do after watching the video?
Create their own qualitative graphs
Solve mathematical equations
Memorize the examples given
Write a report on qualitative graphs
Access all questions and much more by creating a free account
Create resources
Host any resource
Get auto-graded reports
Continue with Google

Continue with Email
Continue with Microsoft
or continue with

%20(1).png)
Apple
Others
Already have an account?
