Interpreting Bar Graphs and Data
Interactive Video
•
Mathematics
•
3rd - 4th Grade
•
Practice Problem
•
Medium

Thomas White
Used 4+ times
FREE Resource
Read more
15 questions
Show all answers
1.
MULTIPLE CHOICE QUESTION
30 sec • 1 pt
What is the main purpose of using graphs in this lesson?
To create artistic designs
To answer questions using data
To learn about different foods
To practice drawing skills
2.
MULTIPLE CHOICE QUESTION
30 sec • 1 pt
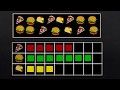
What does the presented bar graph depict?
The nutritional value of foods
The votes for favorite foods
The cost of different foods
The number of people who dislike certain foods
3.
MULTIPLE CHOICE QUESTION
30 sec • 1 pt
What would be a suitable title for the graph?
Cooking Recipes
Favorite Foods
Food Nutrition
Food Prices
4.
MULTIPLE CHOICE QUESTION
30 sec • 1 pt
What is the importance of labeling a graph correctly?
To add more information
To confuse the viewer
To ensure accurate data interpretation
To make it look pretty
5.
MULTIPLE CHOICE QUESTION
30 sec • 1 pt
Which food was chosen as the favorite the most?
Pizza
Salad
Cheeseburger
Taco
6.
MULTIPLE CHOICE QUESTION
30 sec • 1 pt
What should you look for to find the most popular choice in a bar graph?
The bar with the least colors
The bar with the most colors
The tallest bar
The shortest bar
7.
MULTIPLE CHOICE QUESTION
30 sec • 1 pt
Which food was chosen as the favorite the least?
Pasta
Taco
Cheeseburger
Pizza
Access all questions and much more by creating a free account
Create resources
Host any resource
Get auto-graded reports
Continue with Google

Continue with Email
Continue with Microsoft
or continue with

%20(1).png)
Apple
Others
Already have an account?
