Understanding Scatter Plots and Correlations
Interactive Video
•
Mathematics
•
9th - 10th Grade
•
Practice Problem
•
Hard

Thomas White
Used 1+ times
FREE Resource
Read more
15 questions
Show all answers
1.
MULTIPLE CHOICE QUESTION
30 sec • 1 pt
What is a scatter plot used to illustrate?
The relationship between two sets of data
The trend of a single variable over time
The connection between multiple graphs
The average of a data set
2.
MULTIPLE CHOICE QUESTION
30 sec • 1 pt
In a scatter plot, what do the dots represent?
The relationship between two variables
The difference between maximum and minimum values
The sum of all data points
The average value of the data
3.
MULTIPLE CHOICE QUESTION
30 sec • 1 pt
What does a positive correlation in a scatter plot indicate?
As one variable increases, the other decreases
The variables are inversely related
There is no relationship between the variables
As one variable increases, the other also increases
4.
MULTIPLE CHOICE QUESTION
30 sec • 1 pt
Which of the following is an example of a negative correlation?
Number of days in fall and leaves on a tree
Number of hours studied and exam score
Temperature and ice cream sales
Height and weight
5.
MULTIPLE CHOICE QUESTION
30 sec • 1 pt
What does the phrase 'correlation does not imply causation' mean?
Causation is always present in correlated data
Two variables can be related without one causing the other
Correlation is the same as causation
Two correlated variables always affect each other
6.
MULTIPLE CHOICE QUESTION
30 sec • 1 pt
Which of the following scenarios demonstrates no correlation?
The size of a home and the size of its lot
The number of passengers and suitcases on a plane
The number of hours studied and exam score
The number of days in fall and leaves on a tree
7.
MULTIPLE CHOICE QUESTION
30 sec • 1 pt
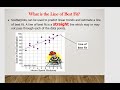
What is the purpose of a line of best fit in a scatter plot?
To connect all data points
To predict trends within the data
To highlight the maximum and minimum values
To show the average of the data
Access all questions and much more by creating a free account
Create resources
Host any resource
Get auto-graded reports
Continue with Google

Continue with Email
Continue with Microsoft
or continue with

%20(1).png)
Apple
Others
Already have an account?
