Understanding Scatter Plots and Data Analysis
Interactive Video
•
Mathematics
•
6th - 8th Grade
•
Practice Problem
•
Hard

Thomas White
FREE Resource
Read more
13 questions
Show all answers
1.
MULTIPLE CHOICE QUESTION
30 sec • 1 pt
What is the primary focus of the first lesson on scatter plots?
Identifying the line of best fit
Understanding the concept of correlation
Calculating percentages
Learning about two-way frequency tables
2.
MULTIPLE CHOICE QUESTION
30 sec • 1 pt
Which equation form is used to represent the line of best fit?
y = ax + b
y = cx + d
y = mx + b
y = bx + m
3.
MULTIPLE CHOICE QUESTION
30 sec • 1 pt
How can you determine the slope of a line on a graph?
By measuring the angle of the line
By counting the number of points on the line
By finding the midpoint of the line
By using rise over run or the slope formula
4.
MULTIPLE CHOICE QUESTION
30 sec • 1 pt
What is the y-intercept of a line?
The lowest point on the line
The highest point on the line
The point where the line crosses the y-axis
The point where the line crosses the x-axis
5.
MULTIPLE CHOICE QUESTION
30 sec • 1 pt
Which statement is true about scatter plots?
They are always functions
They have no slope
They show discrete data
They always show continuous data
6.
MULTIPLE CHOICE QUESTION
30 sec • 1 pt
Why should scatter plot points not be connected?
Because they represent continuous data
Because they form a perfect line
Because they represent discrete data
Because they are always functions
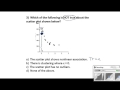
7.
MULTIPLE CHOICE QUESTION
30 sec • 1 pt
Which of the following is not true about scatter plots?
They show nonlinear association
They have clustering at x = 0
They have no outliers
None of the above
Access all questions and much more by creating a free account
Create resources
Host any resource
Get auto-graded reports
Continue with Google

Continue with Email
Continue with Microsoft
or continue with

%20(1).png)
Apple
Others
Already have an account?
