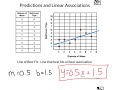
Understanding Residuals and Predictions
Interactive Video
•
Mathematics
•
9th - 10th Grade
•
Practice Problem
•
Hard

Thomas White
FREE Resource
Read more
13 questions
Show all answers
1.
MULTIPLE CHOICE QUESTION
30 sec • 1 pt
Why is it important to draw the example provided in the video?
To have a reference for understanding the video
To compare with other students' drawings
To practice drawing skills
To create a personal art piece
2.
MULTIPLE CHOICE QUESTION
30 sec • 1 pt
What does the line of best fit represent in a graph?
A line that is parallel to the x-axis
A perfect line through all data points
A line that connects the first and last data points
A line that best represents the linear relationship between variables
3.
MULTIPLE CHOICE QUESTION
30 sec • 1 pt
How is the slope of the line of best fit calculated?
By dividing the total number of data points by the number of variables
By finding the difference between the highest and lowest data points
By calculating the rise over run between two points on the line
By averaging all the y-values
4.
MULTIPLE CHOICE QUESTION
30 sec • 1 pt
What does a slope of 0.5 indicate in the context of the problem?
For every two glasses of water, there is one trip to the bathroom
For every additional glass of water, there are 0.5 more trips to the bathroom
For every additional glass of water, there are 0.5 fewer trips to the bathroom
For every glass of water, there are two trips to the bathroom
5.
MULTIPLE CHOICE QUESTION
30 sec • 1 pt
What is the significance of the y-intercept in this scenario?
It shows the maximum number of trips possible
It represents the number of trips to the bathroom with zero glasses of water
It is irrelevant to the problem
It indicates the average number of trips for all data points
6.
MULTIPLE CHOICE QUESTION
30 sec • 1 pt
How many trips to the bathroom are predicted for 12 glasses of water?
6 trips
7.5 trips
12 trips
9 trips
7.
MULTIPLE CHOICE QUESTION
30 sec • 1 pt
What is a residual in the context of predictions?
The maximum error in predictions
The sum of all prediction errors
The difference between the actual and predicted values
The average of all predicted values
Access all questions and much more by creating a free account
Create resources
Host any resource
Get auto-graded reports
Continue with Google

Continue with Email
Continue with Microsoft
or continue with

%20(1).png)
Apple
Others
Already have an account?
