- Resource Library
- Math
- Data And Graphing
- Data Representation
- Understanding Data Representation Techniques
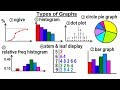
Understanding Data Representation Techniques
Interactive Video
•
Mathematics
•
6th - 8th Grade
•
Practice Problem
•
Hard

Thomas White
FREE Resource
Read more
15 questions
Show all answers
1.
MULTIPLE CHOICE QUESTION
30 sec • 1 pt
What is the primary focus of the second chapter in statistics?
Statistical analysis of data
Graphical representation of data
Probability theory
Data collection methods
2.
MULTIPLE CHOICE QUESTION
30 sec • 1 pt
In a pie chart, what does a larger slice typically indicate?
No relation to data size
An equal portion of the data
A larger portion of the data
A smaller portion of the data
3.
MULTIPLE CHOICE QUESTION
30 sec • 1 pt
Which type of graph is more effective for comparing relative heights?
Stem-and-leaf display
Dot plot
Pie chart
Bar graph
4.
MULTIPLE CHOICE QUESTION
30 sec • 1 pt
What is a key advantage of using dot plots?
They require detailed data analysis
They allow quick graphing of random data
They are useful for large data sets
They are complex to create
5.
MULTIPLE CHOICE QUESTION
30 sec • 1 pt
What is a stem-and-leaf display useful for?
Showing cumulative data
Displaying data distribution
Highlighting data trends
Comparing data sets
6.
MULTIPLE CHOICE QUESTION
30 sec • 1 pt
What is the main difference between bar graphs and histograms?
Histograms are not used in statistics
Histograms are for specific data sets
Bar graphs are for specific data sets
Bar graphs are for ranges of data
7.
MULTIPLE CHOICE QUESTION
30 sec • 1 pt
What is a common confusion between bar graphs and histograms?
Histograms are for specific data, bar graphs for ranges
Bar graphs are for specific data, histograms for ranges
Both are used for data ranges
Both are used for specific data sets
Access all questions and much more by creating a free account
Create resources
Host any resource
Get auto-graded reports
Continue with Google

Continue with Email
Continue with Microsoft
or continue with

%20(1).png)
Apple
Others
Already have an account?
