Comparing Populations and Significance Testing
Interactive Video
•
Mathematics
•
9th - 10th Grade
•
Hard

Thomas White
FREE Resource
Read more
10 questions
Show all answers
1.
MULTIPLE CHOICE QUESTION
30 sec • 1 pt
What is the primary focus of the new lesson on significance testing?
Comparing two populations using proportions and means
Reviewing one proportion and one mean significance testing
Understanding randomization in experiments
Learning about matched pair data scenarios
2.
MULTIPLE CHOICE QUESTION
30 sec • 1 pt
How do you differentiate between a two proportions scenario and a matched pair data scenario?
By the method of randomization used
By the type of data collected
By the number of populations involved
By the number of samples collected
3.
MULTIPLE CHOICE QUESTION
30 sec • 1 pt
Why is it important to keep track of subscripts when dealing with differences in populations?
To simplify the calculation process
To correctly interpret p-values and test statistics
To ensure accurate data collection
To avoid sampling errors
4.
MULTIPLE CHOICE QUESTION
30 sec • 1 pt
In the example of homework completion rates, what is being compared?
The percentage of students doing homework in two schools
The homework policies of two schools
The academic performance of students in two schools
The teaching methods of two schools
5.
MULTIPLE CHOICE QUESTION
30 sec • 1 pt
What characteristic do the sampling distributions of p1-hat and p2-hat share?
They have identical variances
They are skewed to the right
They are approximately normal
They have identical means
6.
MULTIPLE CHOICE QUESTION
30 sec • 1 pt
When combining distributions, what must be done to the standard deviations?
Add them directly
Subtract them
Combine the variances and then square root
Multiply them
7.
MULTIPLE CHOICE QUESTION
30 sec • 1 pt
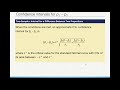
What is the first condition that must be met when creating a confidence interval?
The populations must be independent
Randomization must be ensured
The data must be normally distributed
The sample size must be large
Access all questions and much more by creating a free account
Create resources
Host any resource
Get auto-graded reports
Continue with Google

Continue with Email
Continue with Microsoft
or continue with

%20(1).png)
Apple
Others
Already have an account?
