Understanding Proportional Relationships
Interactive Video
•
Mathematics
•
9th - 10th Grade
•
Hard

Thomas White
FREE Resource
Read more
13 questions
Show all answers
1.
MULTIPLE CHOICE QUESTION
30 sec • 1 pt
What is the main focus of today's lesson?
Understanding fractions
Exploring ratios and proportional relationships
Learning about algebraic expressions
Studying geometric shapes
2.
MULTIPLE CHOICE QUESTION
30 sec • 1 pt
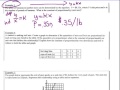
If half a gallon of paint covers 1/6 of a wall, how much paint is needed for the entire wall?
4 gallons
3 gallons
2 gallons
1 gallon
3.
MULTIPLE CHOICE QUESTION
30 sec • 1 pt
Which method is NOT used to calculate the paint needed for the wall?
Performing division
Using a calculator
Setting up an equivalent fraction
Drawing a picture
4.
MULTIPLE CHOICE QUESTION
30 sec • 1 pt
What does a constant of proportionality represent in a table?
A geometric shape
A random number
A fixed ratio between two quantities
A variable that changes
5.
MULTIPLE CHOICE QUESTION
30 sec • 1 pt
In a table, if y/x gives a constant value, what does it indicate?
An undefined relationship
A proportional relationship
A non-proportional relationship
A geometric progression
6.
MULTIPLE CHOICE QUESTION
30 sec • 1 pt
What is a key feature of a graph that shows a proportional relationship?
It forms a curve
It is a vertical line
It passes through the origin
It has multiple lines
7.
MULTIPLE CHOICE QUESTION
30 sec • 1 pt
How can you determine the constant of proportionality from a graph?
By finding the slope of the line
By measuring the length of the line
By identifying the y-intercept
By counting the number of points
Access all questions and much more by creating a free account
Create resources
Host any resource
Get auto-graded reports
Continue with Google

Continue with Email
Continue with Classlink
Continue with Clever
or continue with
Microsoft
%20(1).png)
Apple
Others
Already have an account?
