Understanding Intercepts in Graphing
Interactive Video
•
Mathematics
•
9th - 10th Grade
•
Hard

Thomas White
FREE Resource
Read more
15 questions
Show all answers
1.
MULTIPLE CHOICE QUESTION
30 sec • 1 pt
What is the significance of intercepts in graphing?
They are used to calculate the area under the curve.
They determine the slope of the line.
They indicate where the line crosses the axes.
They show the maximum and minimum values.
2.
MULTIPLE CHOICE QUESTION
30 sec • 1 pt
Which axis does the x-intercept cross?
Y-axis
Z-axis
None of the above
X-axis
3.
MULTIPLE CHOICE QUESTION
30 sec • 1 pt
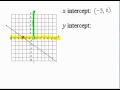
What is the x-intercept of the line in the example?
0, -3
-3, 0
3, 0
0, 3
4.
MULTIPLE CHOICE QUESTION
30 sec • 1 pt
Which point is the x-intercept in the example?
(0, -2)
(-3, 0)
(0, 3)
(3, 0)
5.
MULTIPLE CHOICE QUESTION
30 sec • 1 pt
What does the y-intercept represent?
The lowest point on the graph
The highest point on the graph
The point where the line crosses the y-axis
The point where the line crosses the x-axis
6.
MULTIPLE CHOICE QUESTION
30 sec • 1 pt
What is the y-intercept of the line in the example?
0, 2
2, 0
-2, 0
0, -2
7.
MULTIPLE CHOICE QUESTION
30 sec • 1 pt
Which point is the y-intercept in the example?
(-3, 0)
(3, 0)
(0, -2)
(0, 3)
Access all questions and much more by creating a free account
Create resources
Host any resource
Get auto-graded reports
Continue with Google

Continue with Email
Continue with Microsoft
or continue with

%20(1).png)
Apple
Others
Already have an account?
