Understanding Ternary Plots and GDP Composition
Interactive Video
•
Mathematics
•
9th - 10th Grade
•
Practice Problem
•
Hard

Jennifer Brown
FREE Resource
10 questions
Show all answers
1.
MULTIPLE CHOICE QUESTION
30 sec • 1 pt
What is another name for a triangular graph?
Binary plot
Ternary plot
Quadratic plot
Linear plot
2.
MULTIPLE CHOICE QUESTION
30 sec • 1 pt
What is the first step in constructing a triangular graph?
Labeling the axes
Plotting data points
Drawing an equilateral triangle
Drawing parallel lines
3.
MULTIPLE CHOICE QUESTION
30 sec • 1 pt
How long should each axis be when constructing a triangular graph?
5 centimeters
15 centimeters
10 centimeters
20 centimeters
4.
MULTIPLE CHOICE QUESTION
30 sec • 1 pt
What is the purpose of drawing parallel lines at a 60-degree angle?
To label the axes
To divide the graph into equal sections
To help plot data points accurately
To make the graph look symmetrical
5.
MULTIPLE CHOICE QUESTION
30 sec • 1 pt
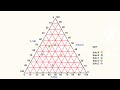
Which axis is labeled as 'agriculture' in the triangular graph?
The horizontal axis
The right axis
The left axis
The vertical axis
6.
MULTIPLE CHOICE QUESTION
30 sec • 1 pt
How do you find the intersection point for a country's data on the graph?
By using a ruler to measure distances
By drawing a circle around the data
By following the lines from each axis until they meet
By estimating visually
7.
MULTIPLE CHOICE QUESTION
30 sec • 1 pt
What should the sum of the percentages for agriculture, industry, and services equal?
100%
150%
50%
75%
Access all questions and much more by creating a free account
Create resources
Host any resource
Get auto-graded reports
Continue with Google

Continue with Email
Continue with Classlink
Continue with Clever
or continue with
Microsoft
%20(1).png)
Apple
Others
Already have an account?
