
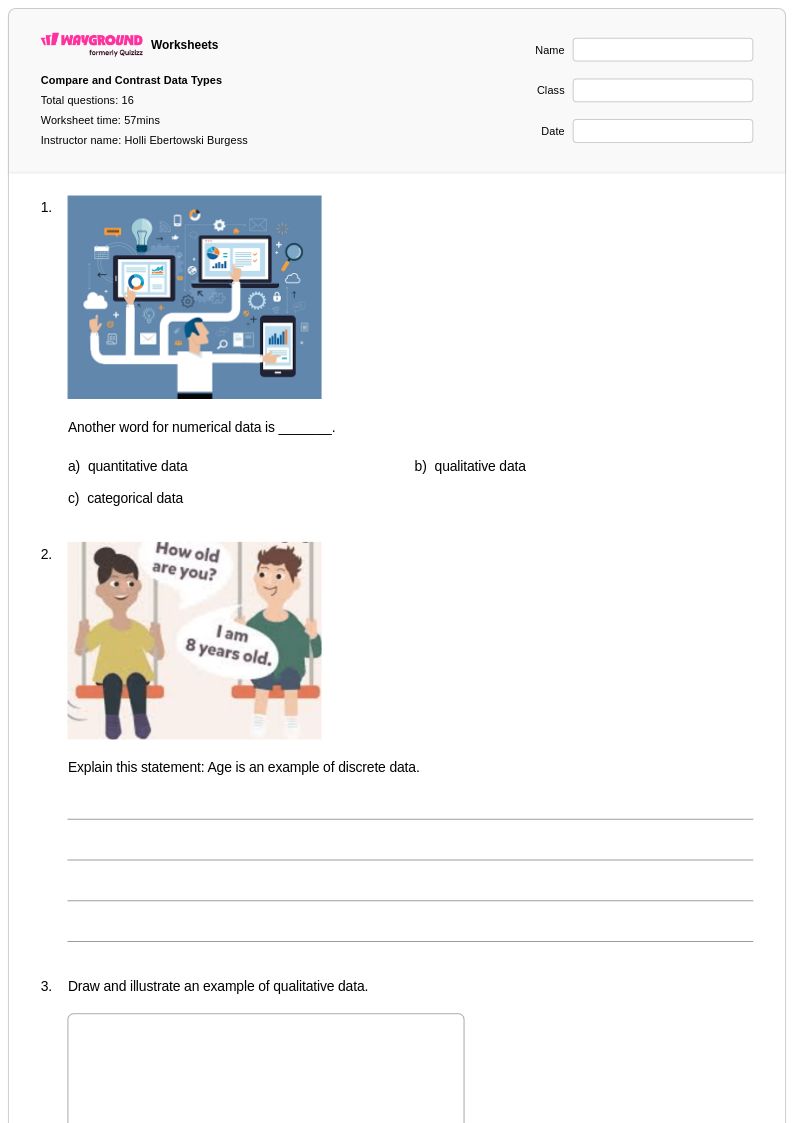
16 Q
3rd - 5th
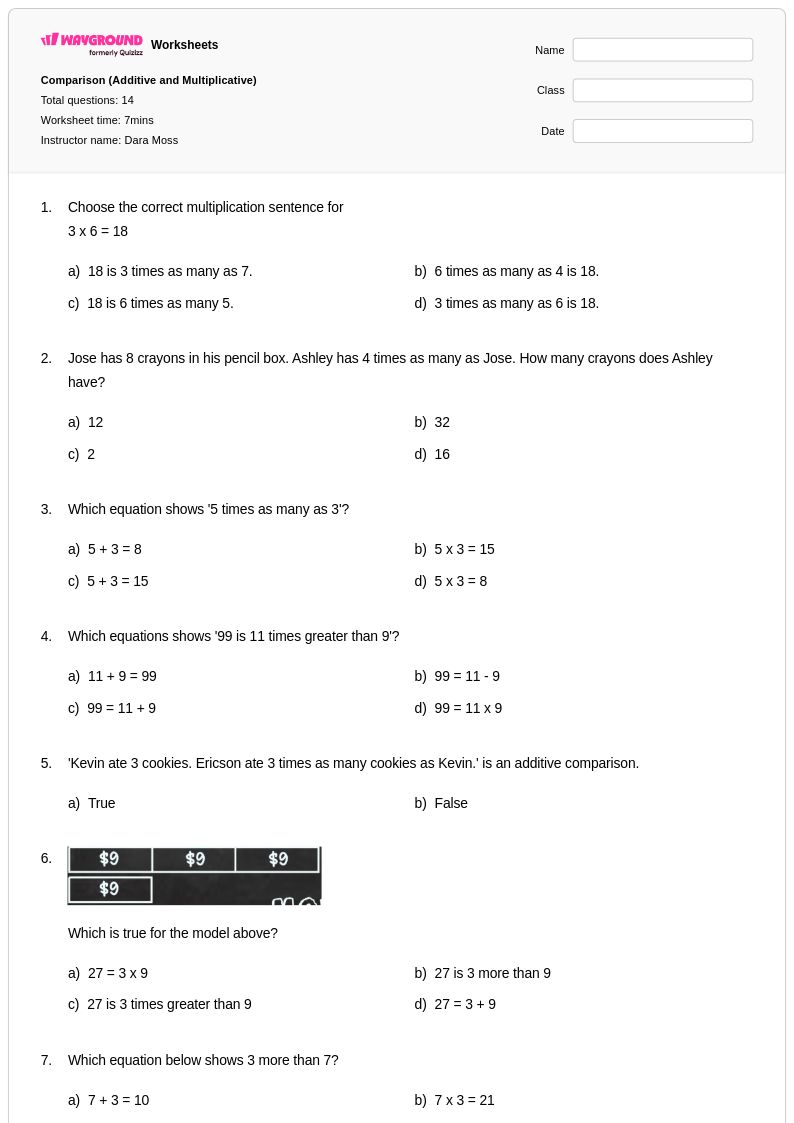
14 Q
4th
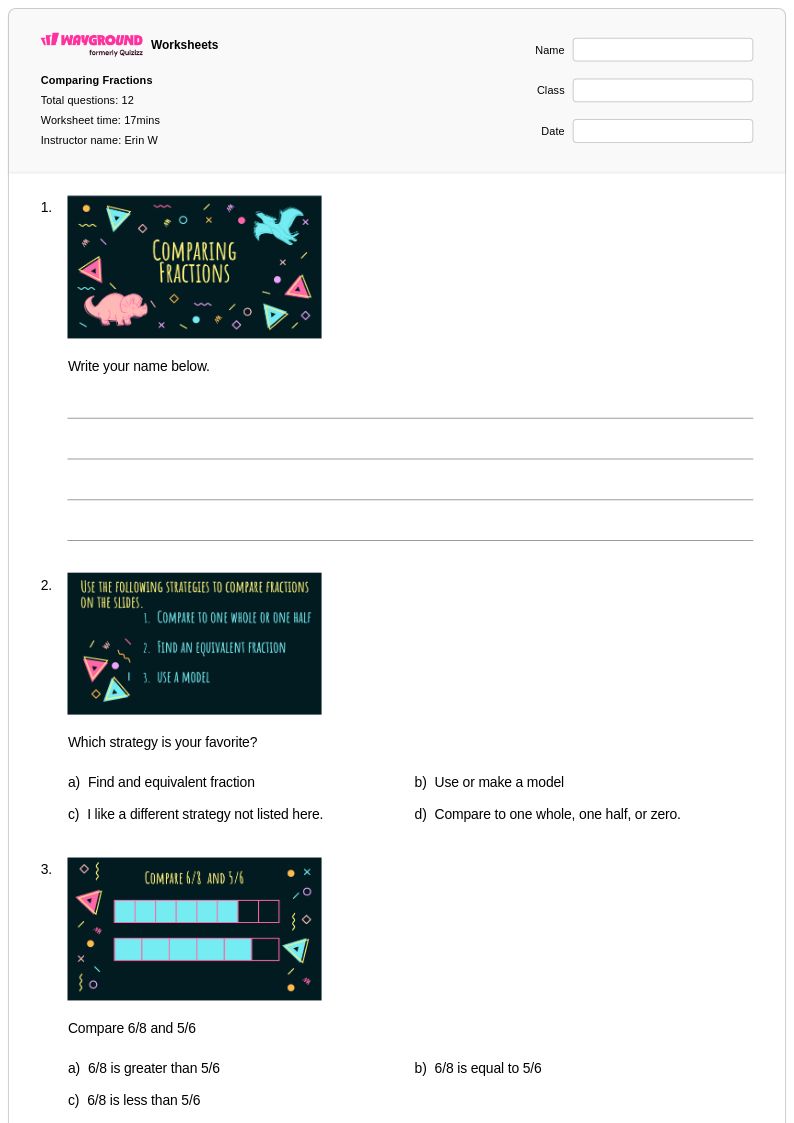
12 Q
4th
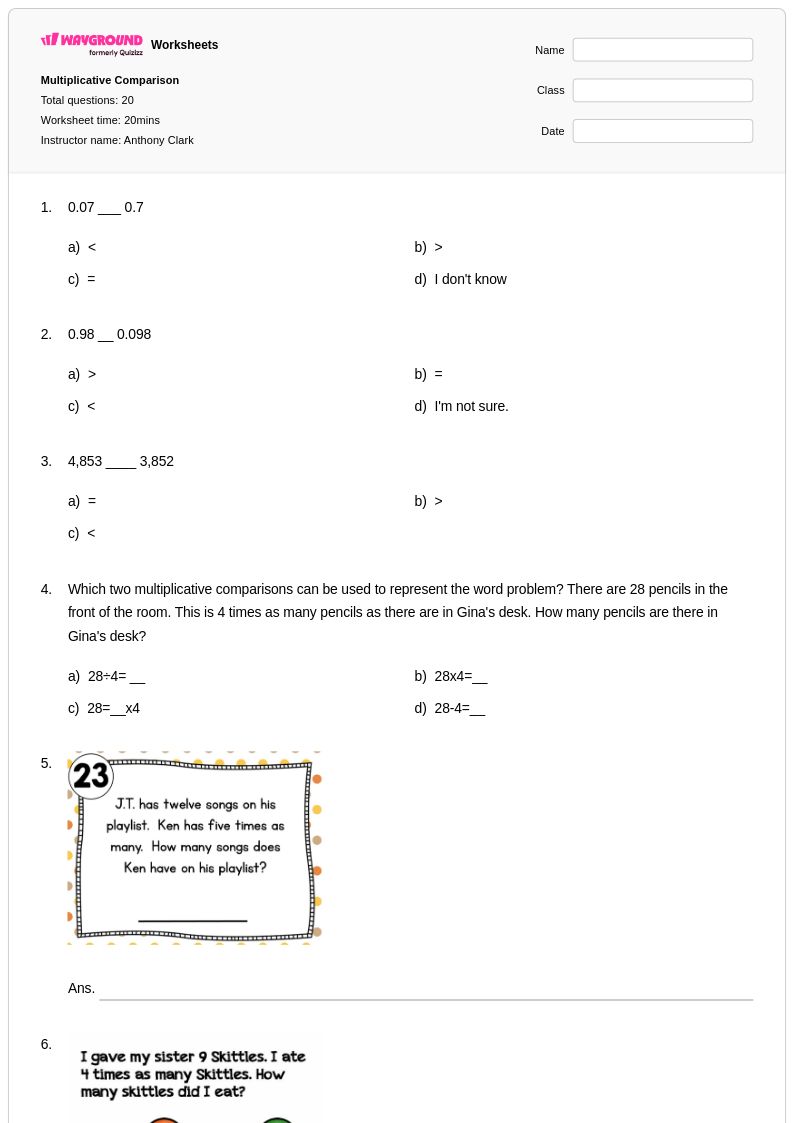
20 Q
4th - Uni
42 Q
4th
10 Q
4th
10 Q
4th
19 Q
4th - Uni
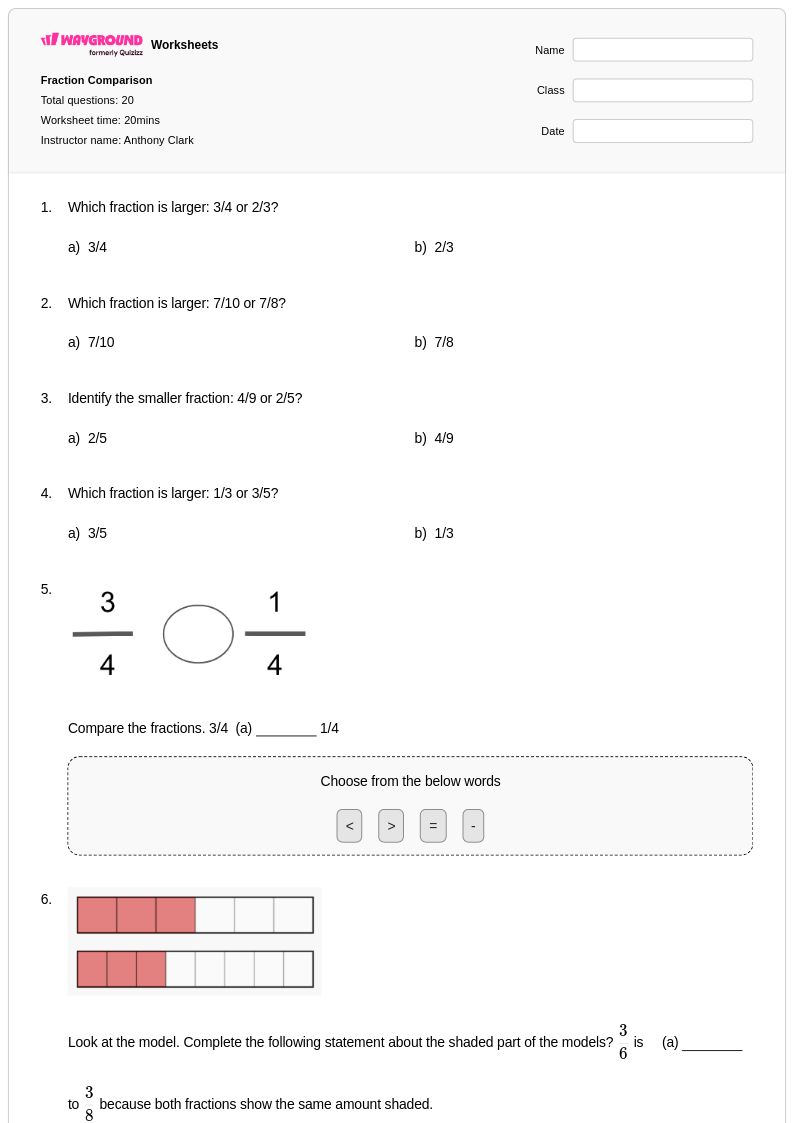
20 Q
3rd - Uni
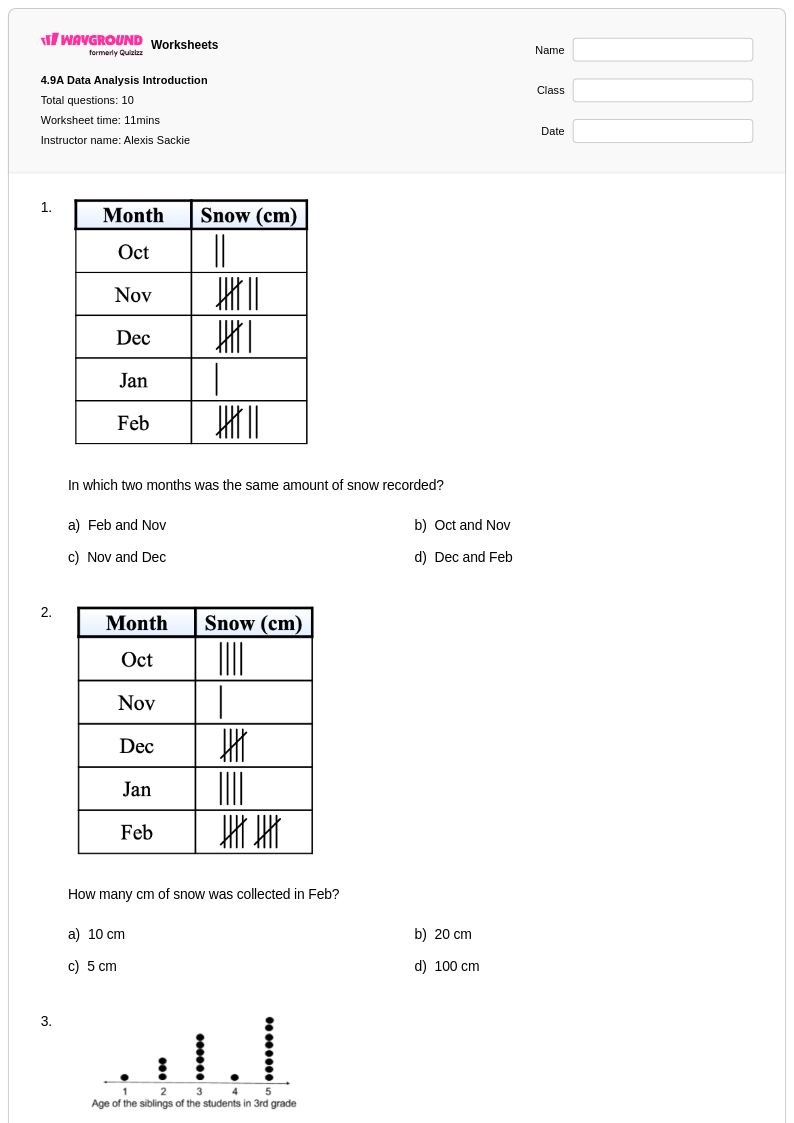
10 Q
4th
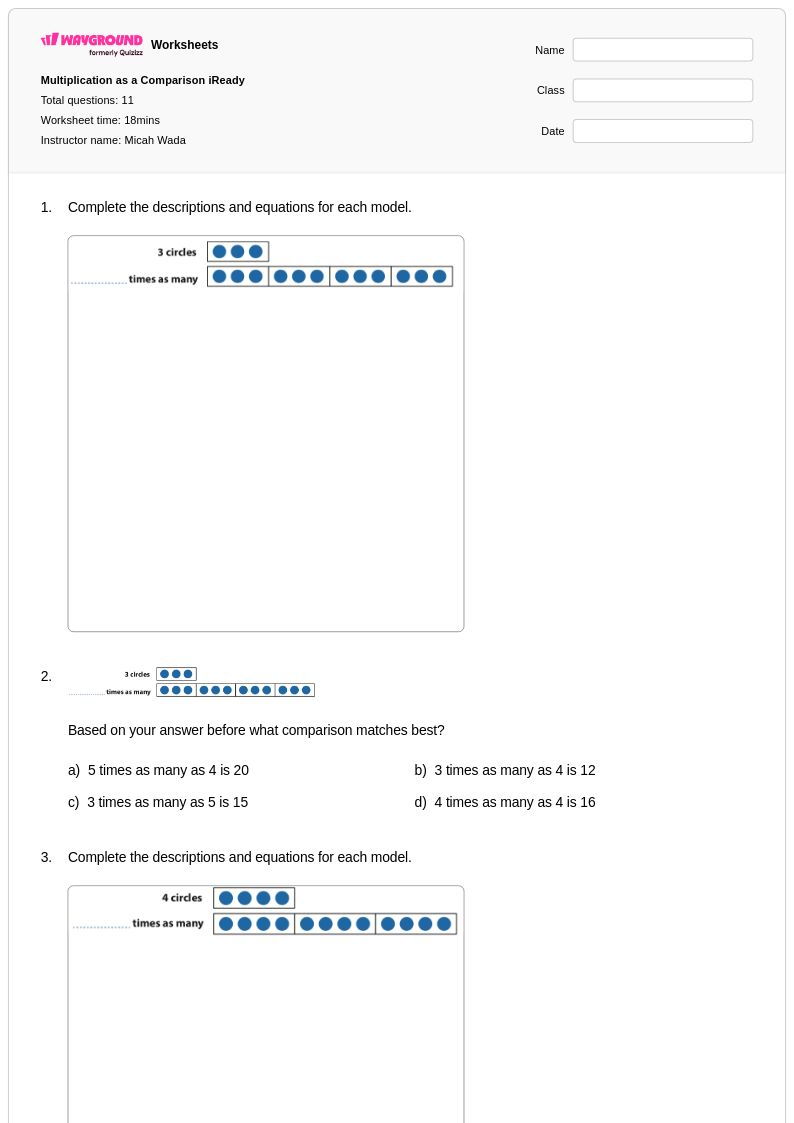
11 Q
4th
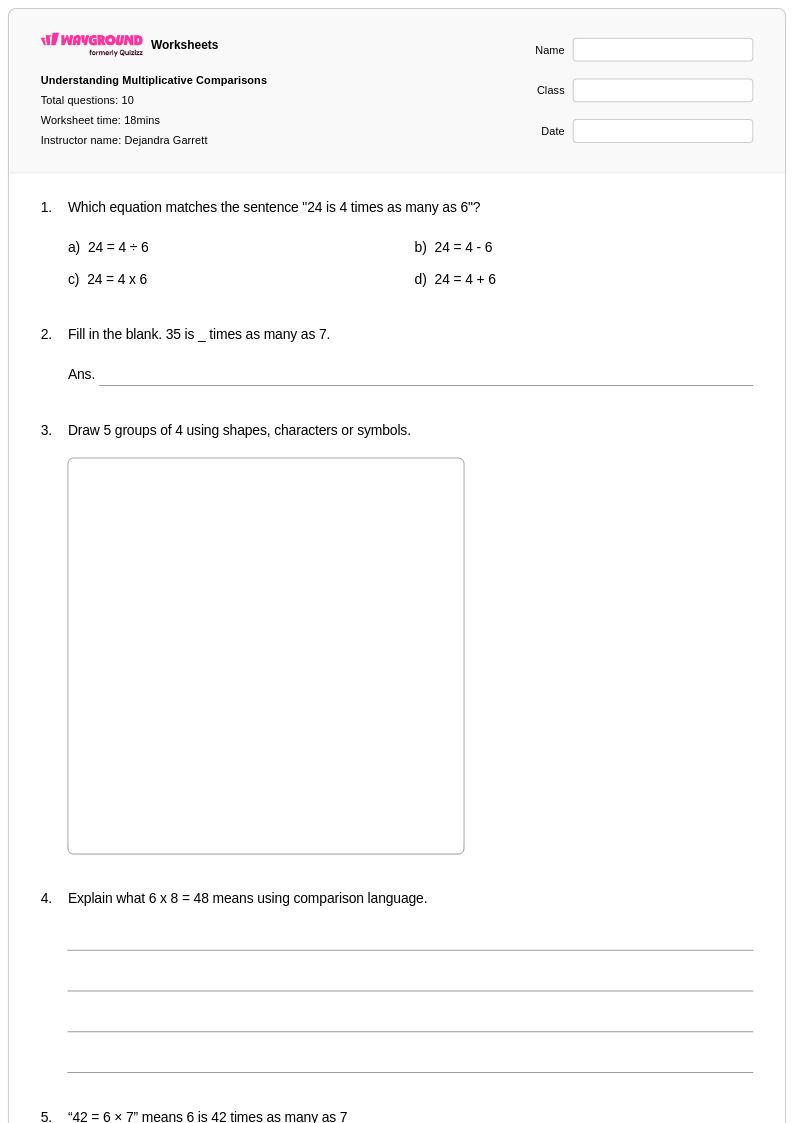
10 Q
4th

10 Q
4th
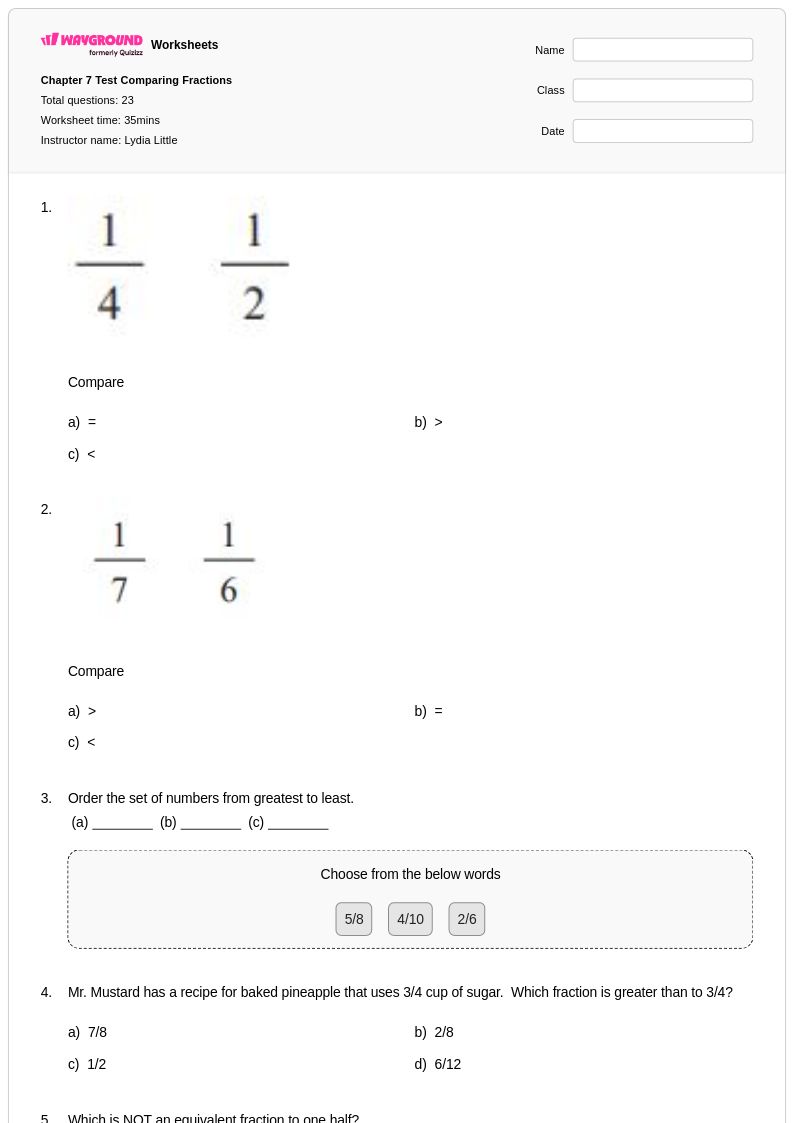
23 Q
4th
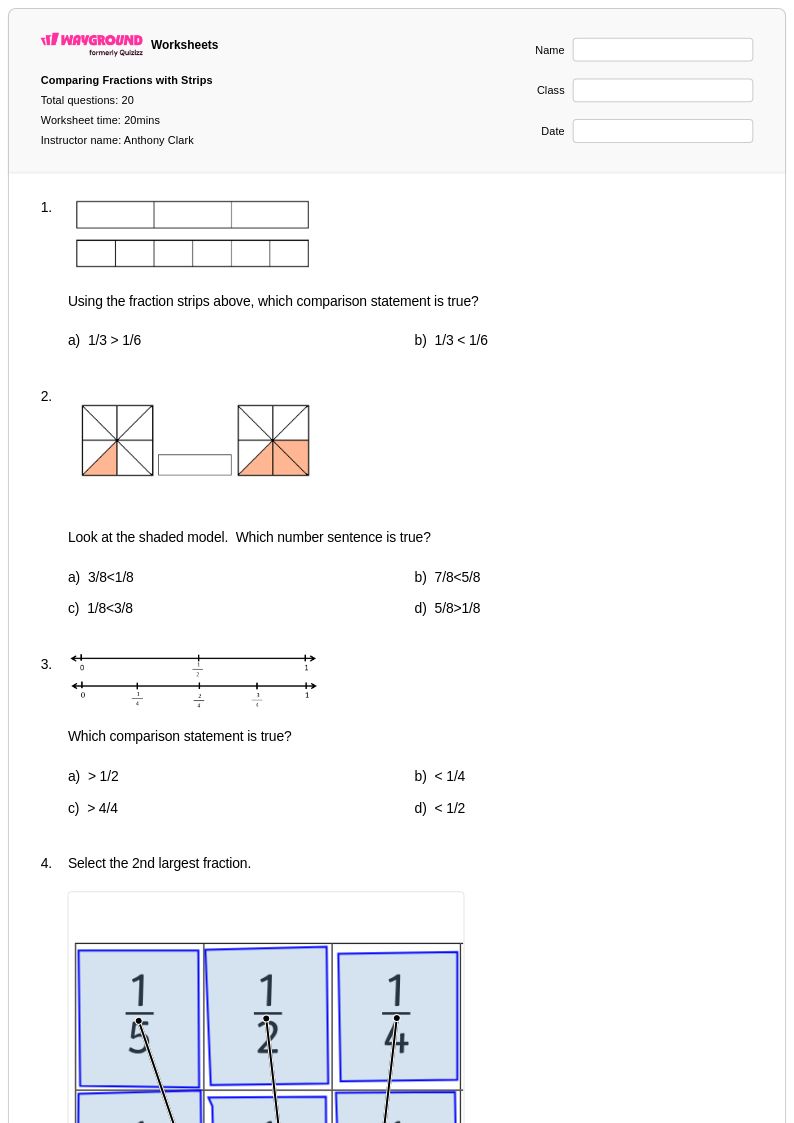
20 Q
3rd - Uni
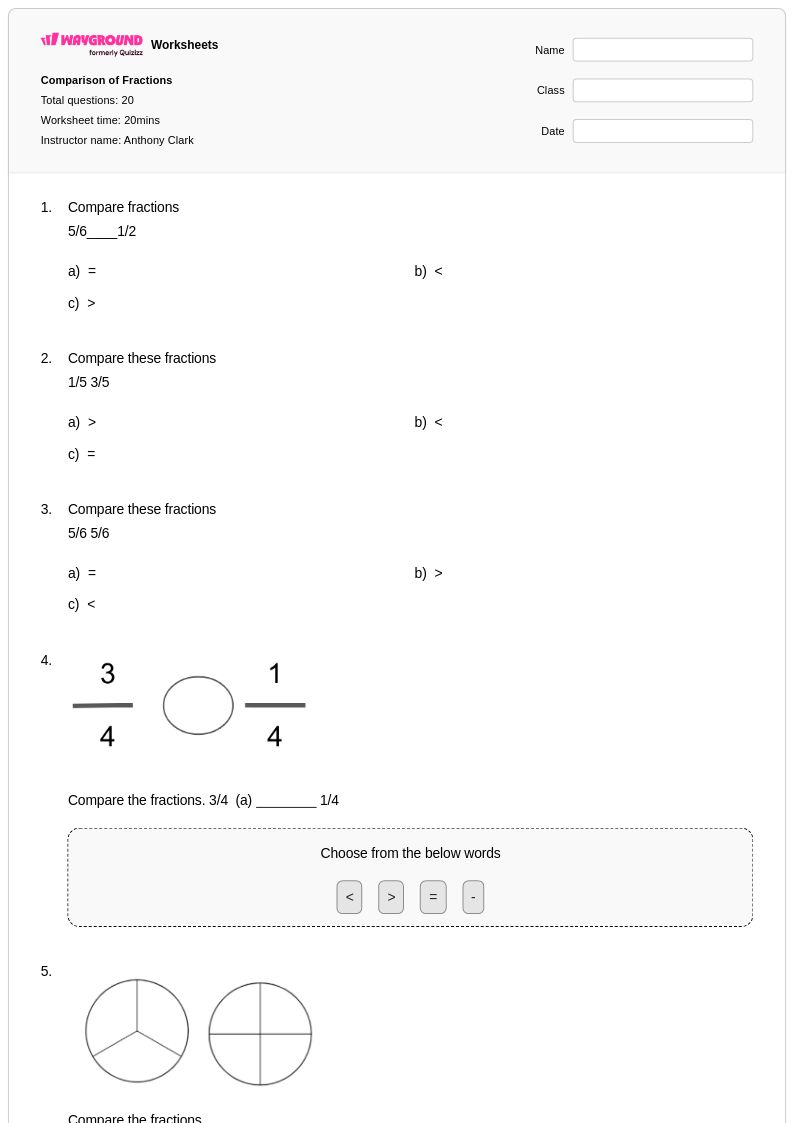
20 Q
4th - Uni
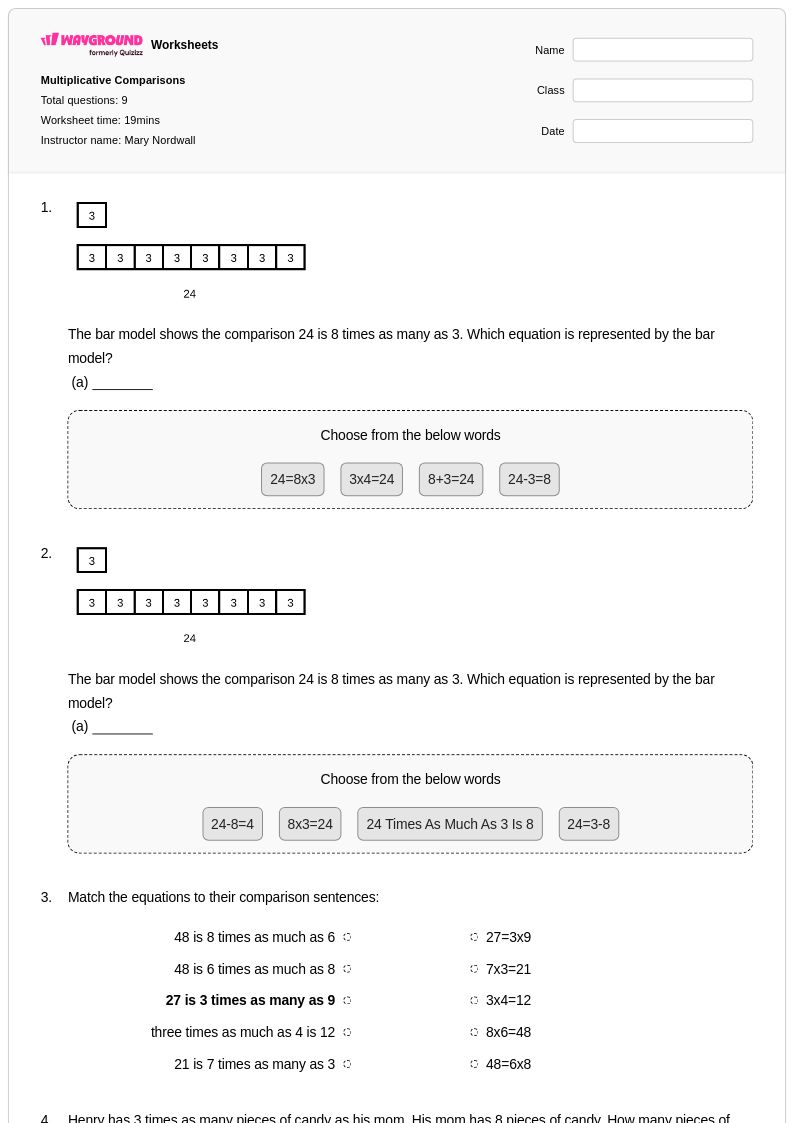
9 Q
4th
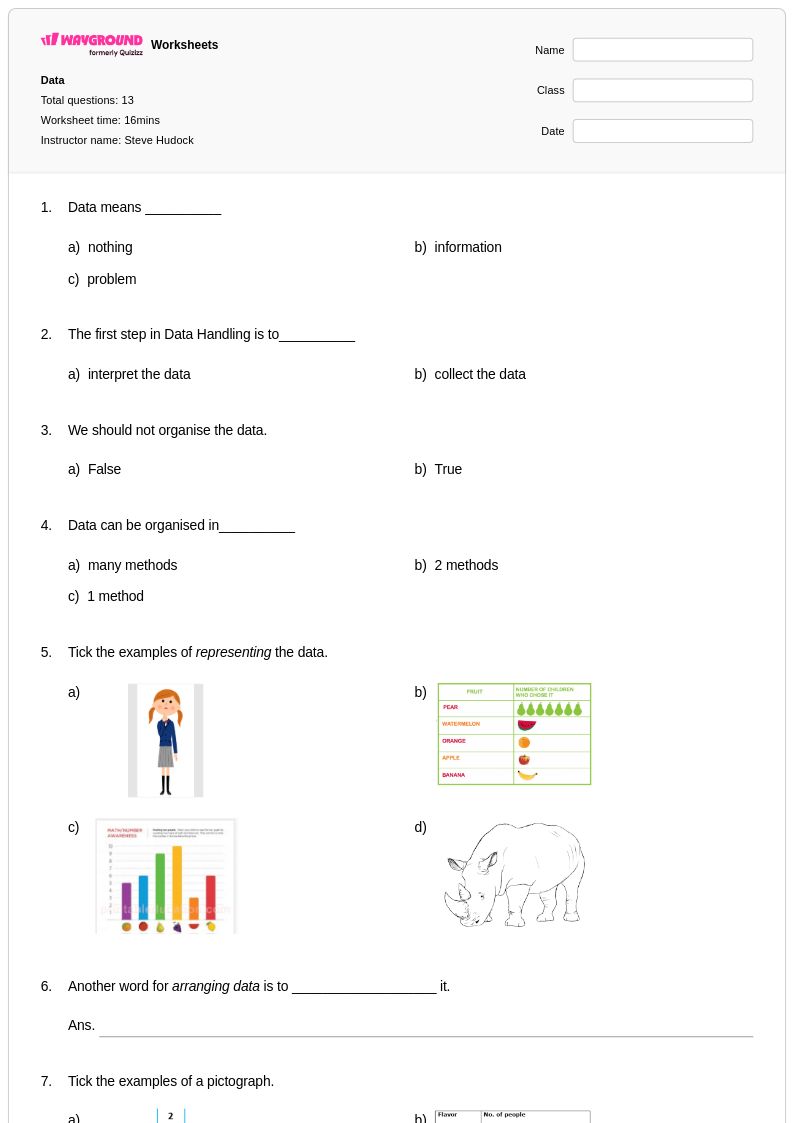
13 Q
4th
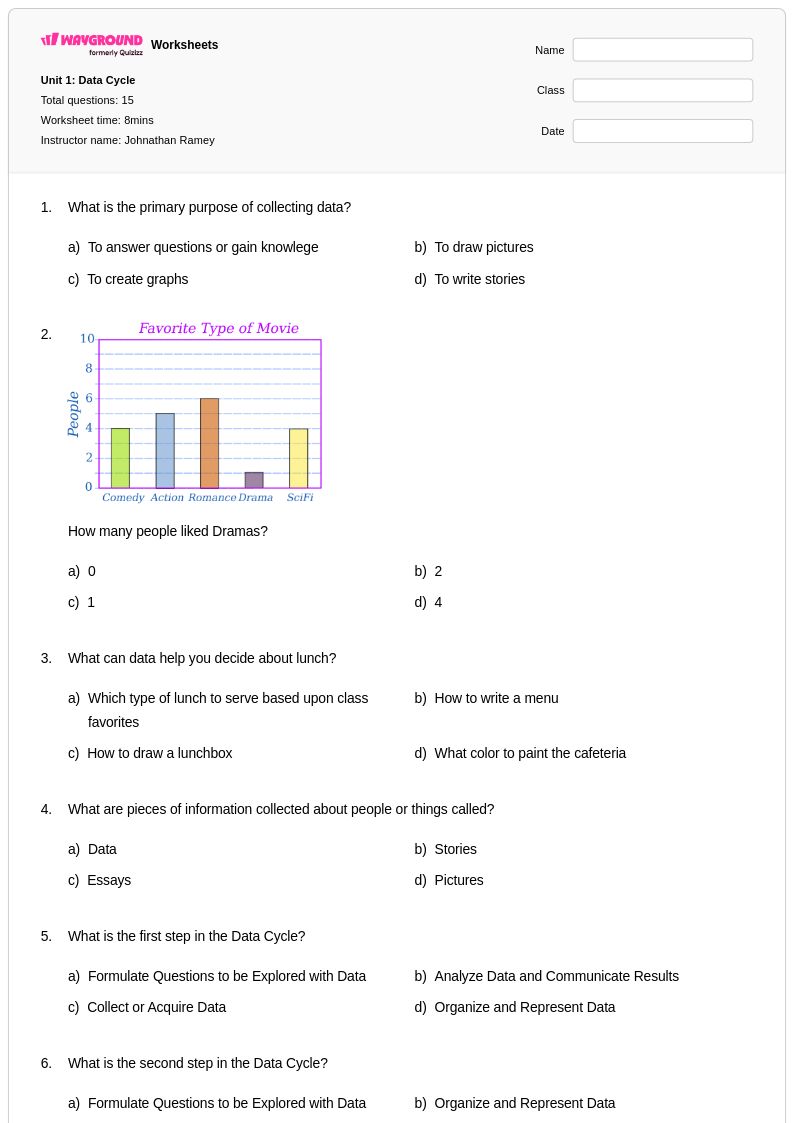
15 Q
4th
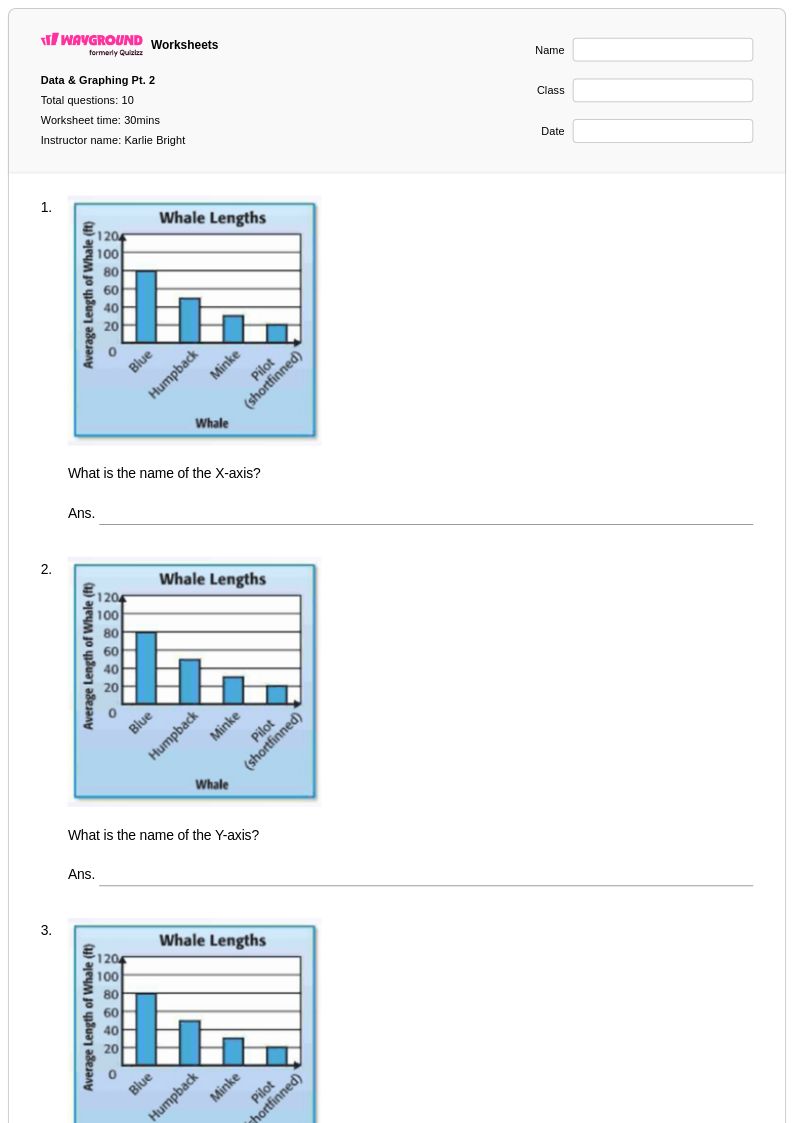
10 Q
4th
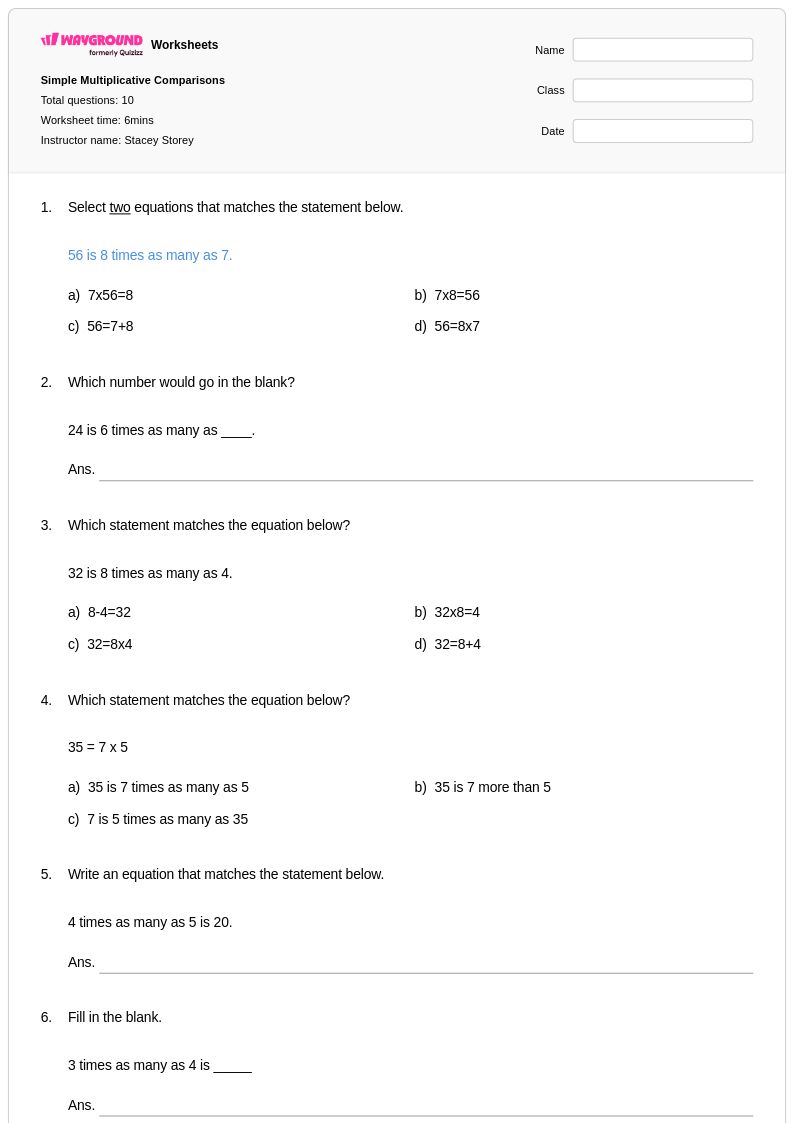
10 Q
4th
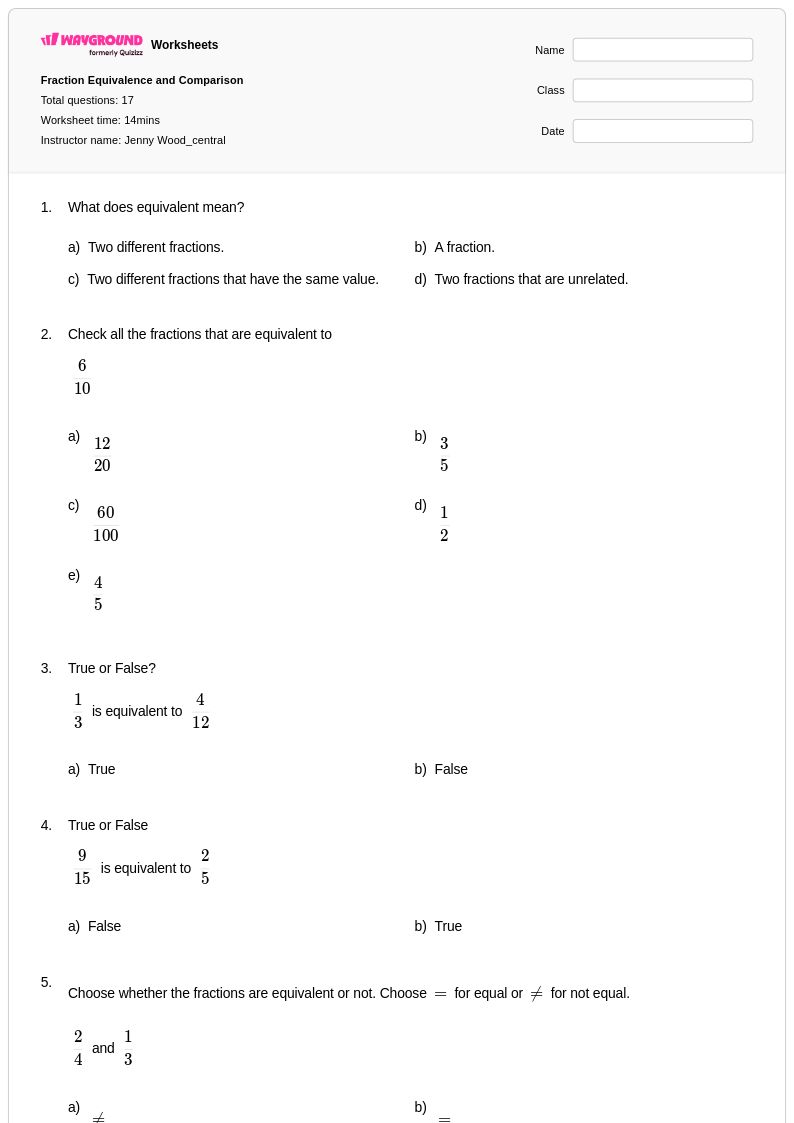
17 Q
4th
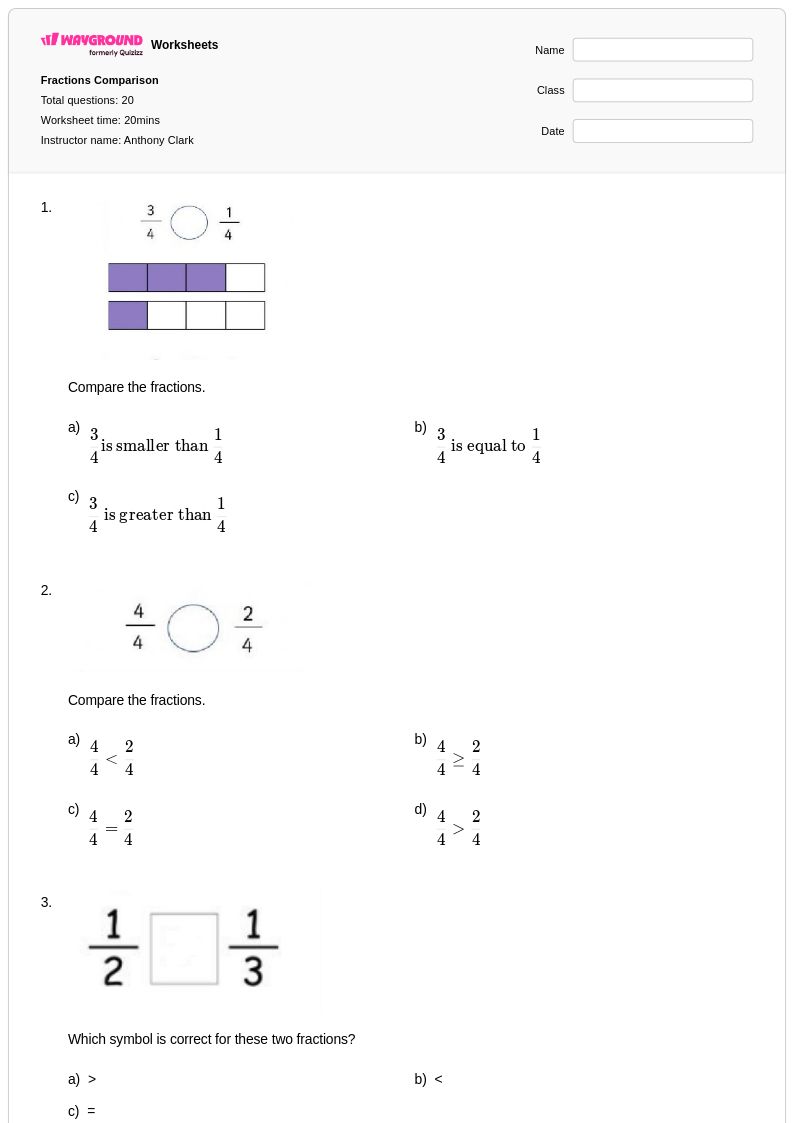
20 Q
4th - Uni
Explore Other Subject Worksheets for year 4
Explore printable Data Comparison worksheets for Year 4
Data comparison worksheets for Year 4 students available through Wayground (formerly Quizizz) provide essential practice in analyzing and interpreting different data sets to draw meaningful conclusions. These comprehensive worksheets strengthen critical mathematical skills including reading various graph types, identifying patterns across multiple data sources, and making evidence-based comparisons between different information presentations. Students engage with practice problems that challenge them to examine bar graphs, pictographs, line plots, and tables side by side, developing the analytical thinking necessary to determine which data set shows greater values, identify trends, and articulate differences between comparable information. Each worksheet includes a detailed answer key and is available as a free printable pdf, ensuring educators have the resources needed to support student learning in this fundamental area of mathematical literacy.
Wayground (formerly Quizizz) empowers teachers with millions of educator-created data comparison resources specifically designed for Year 4 mathematics instruction, featuring robust search and filtering capabilities that align with curriculum standards and learning objectives. The platform's differentiation tools allow instructors to customize worksheets based on individual student needs, while flexible formatting options provide both printable pdf versions for traditional classroom use and digital formats for interactive learning environments. These comprehensive features streamline lesson planning by offering immediate access to high-quality practice materials, support targeted remediation for students struggling with comparative analysis skills, and enable enrichment opportunities for advanced learners ready to tackle more complex data interpretation challenges, ultimately helping educators deliver effective instruction that builds confidence in mathematical reasoning and data literacy.
FAQs
How do I teach data comparison to fourth graders?
What exercises build Grade 4 data comparison skills?
What errors should I watch for when fourth graders compare data?
How can I use a Grade 4 data comparison worksheet on Wayground?
How does Grade 4 data comparison fit the Common Core math progression?
How can I differentiate Grade 4 data comparison practice?
What grade level is data comparison taught at?