Free Printable Density Graphs Worksheets for Year 11
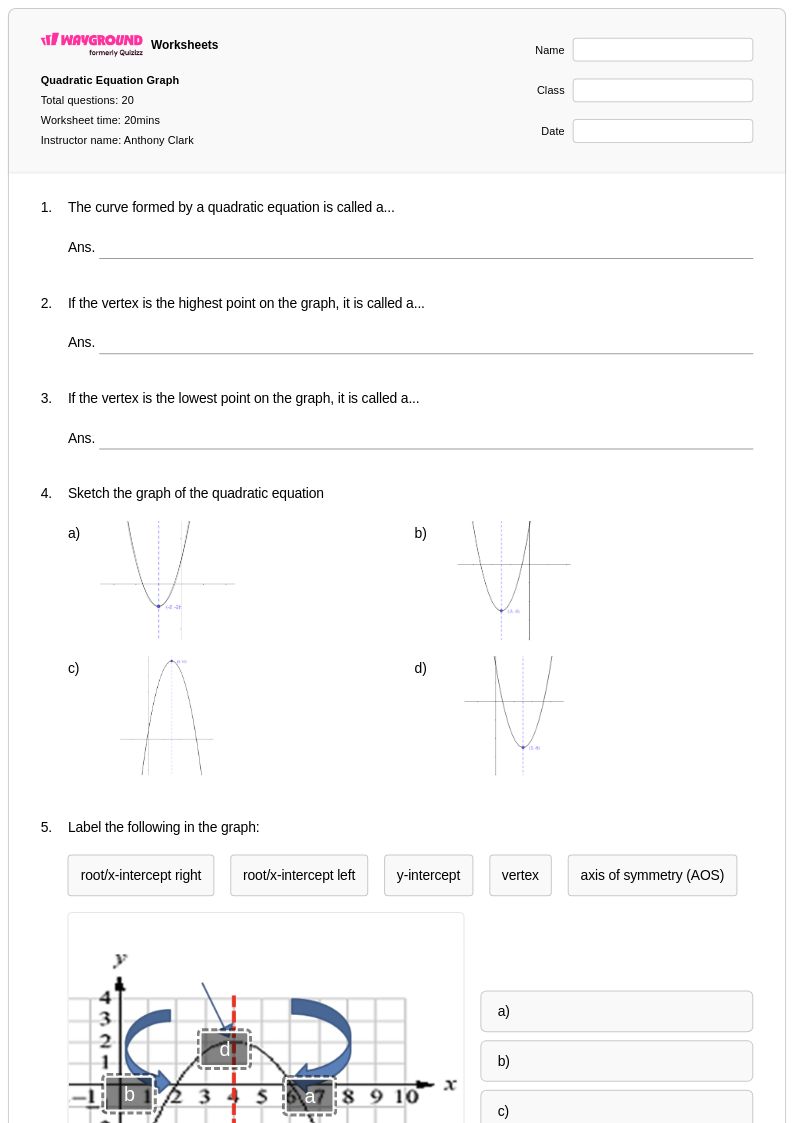
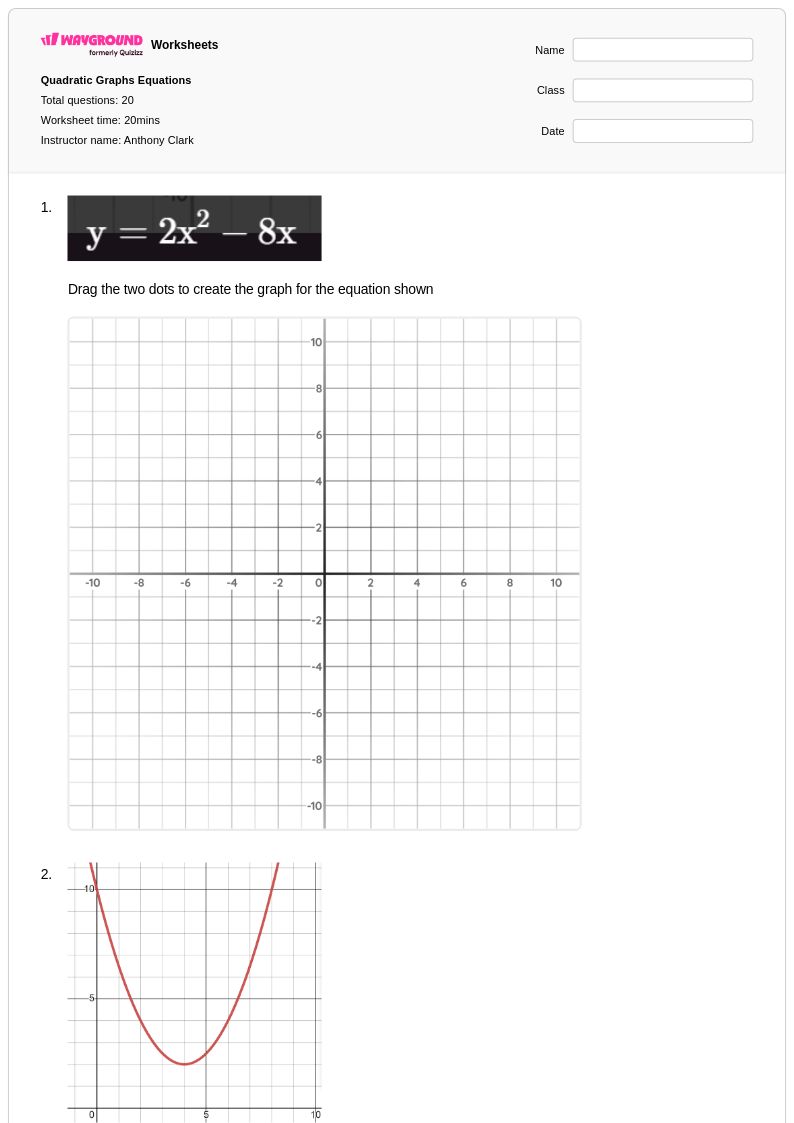
Wayground's Year 11 density graphs worksheets provide comprehensive printables and practice problems to help students master interpreting and analyzing statistical distributions, complete with answer keys and free PDF downloads.
Explore printable Density Graphs worksheets for Year 11
Density graphs represent a fundamental concept in Year 11 probability and statistics, requiring students to interpret and analyze continuous probability distributions through visual representations. Wayground's comprehensive collection of density graph worksheets provides students with essential practice in reading probability density functions, calculating areas under curves, and understanding how these graphs relate to real-world probability scenarios. These carefully crafted practice problems strengthen critical skills including identifying probability regions, computing cumulative probabilities, and interpreting the relationship between density curves and probability outcomes. Each worksheet includes a detailed answer key and is available as a free printable pdf, allowing students to work through problems systematically while building confidence in this challenging mathematical concept that bridges theoretical probability with practical statistical applications.
Wayground, formerly Quizizz, empowers mathematics educators with an extensive library of millions of teacher-created resources specifically designed for probability and statistics instruction at the Year 11 level. The platform's advanced search and filtering capabilities enable teachers to quickly locate density graph worksheets that align with curriculum standards and match their students' specific learning needs. Robust differentiation tools allow educators to customize problem difficulty levels, while the flexible format options support both digital classroom integration and traditional printable pdf distribution. These comprehensive resources prove invaluable for lesson planning, targeted skill remediation, and enrichment activities, helping teachers address diverse learning styles while ensuring students develop mastery of density graph interpretation and analysis through structured, progressive practice opportunities.
FAQs
How do I teach probability density functions to 11th graders?
At Grade 11, students are ready to treat density graphs more formally. The central idea to reinforce is that a probability density function describes the relative likelihood of a continuous random variable taking on a value — and that likelihood is only meaningful over an interval, not at a single point. A useful classroom move: ask students why P(X = exactly 1.5) equals zero for a continuous distribution. Working through that question forces them to confront what 'area under a single point' means geometrically, which solidifies the concept more than any definition will.
What do Grade 11 density graph worksheets focus on?
Grade 11 practice typically emphasizes: computing cumulative probabilities from density curves, identifying probability regions for compound events, interpreting the relationship between a density function and its cumulative distribution, and working with both normal and non-normal continuous models. Wayground's Grade 11 worksheets include complete answer keys and are available as printable PDFs or digital assignments, making them practical for in-class work, homework, or test prep.
What mistakes do 11th graders make with probability density functions?
The most common one at this level is conflating the density function with the cumulative distribution function — students will read a CDF graph and try to interpret the y-value as a density, or vice versa. A related error: computing P(a < X < b) by subtracting f(b) − f(a) instead of integrating (or using the CDF correctly). Students also frequently forget that a valid PDF must have total area equal to 1, so they don't check whether a given function is even a legitimate density before working with it.
How do I use Wayground's Grade 11 density graph worksheets in class?
You can assign these as a digital quiz on Wayground — students work through problems on their devices and you get real-time data on where the class is struggling. For a paper-based option, download the printable PDF; every worksheet includes a detailed answer key so students can self-check after completing it. If you're grading paper submissions, the Wayground for Teachers app lets you scan student work from your phone rather than entering scores manually.
How does Common Core sequence density graphs at the Grade 11 level?
By Grade 11, Common Core expects students to use the normal distribution fluently as a probability model — not just recognize its shape, but calculate probabilities for specified intervals and use those calculations to make decisions about real data. This builds on the descriptive work of earlier grades and points toward inferential reasoning: once students can find the probability that a value falls in a given range, they're positioned to ask whether an observed value is unusually extreme, which is the foundation of hypothesis testing in AP Statistics or college-level courses.
How can I support diverse learners on Grade 11 density graph assignments?
Density graph problems at this level are text-heavy and notation-dense, which creates barriers for students with reading difficulties or language processing challenges. Wayground's Read Aloud accommodation reads question text aloud for students who need it, and you can apply a dyslexia-friendly font to the worksheet without changing the mathematical content. For students who are overwhelmed by multi-part problems, reducing answer choices on digital questions lowers the cognitive load while keeping the core statistical reasoning intact.