Free Printable Density Graphs Worksheets for Year 12
Enhance Year 12 students' understanding of density graphs with Wayground's comprehensive collection of free worksheets, featuring printable PDFs with practice problems and complete answer keys for mastering statistical data visualization.
Explore printable Density Graphs worksheets for Year 12
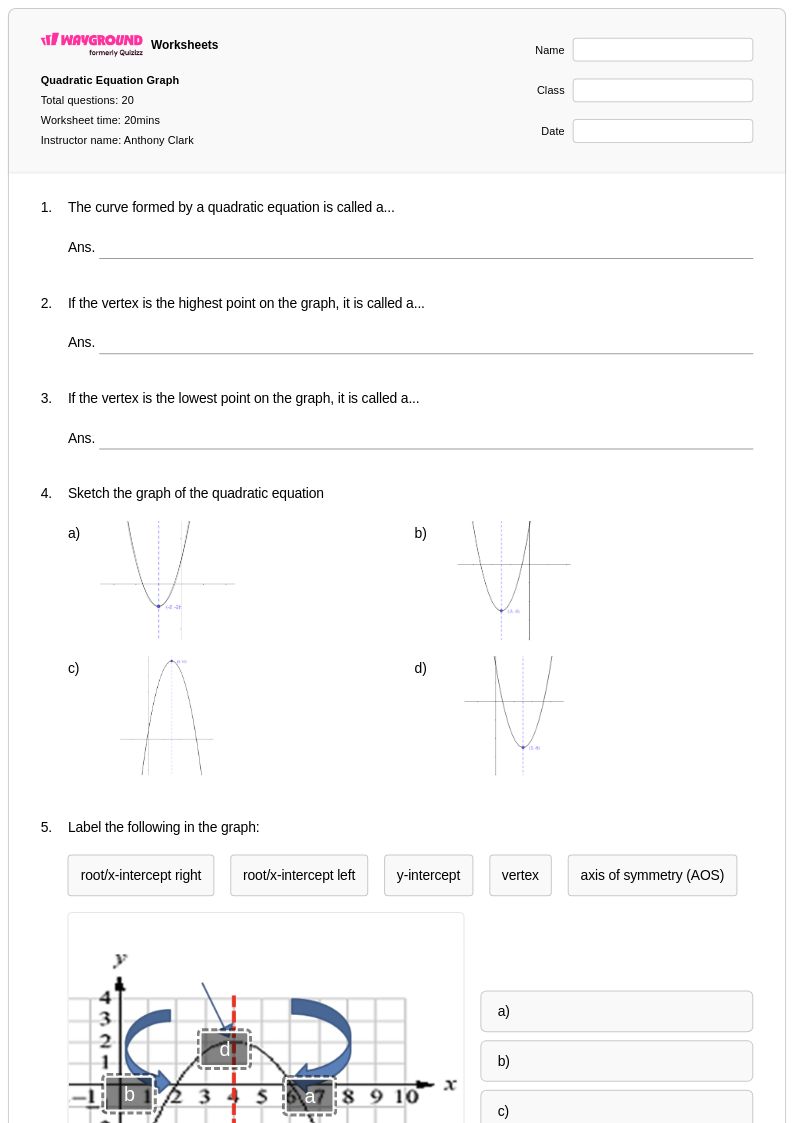
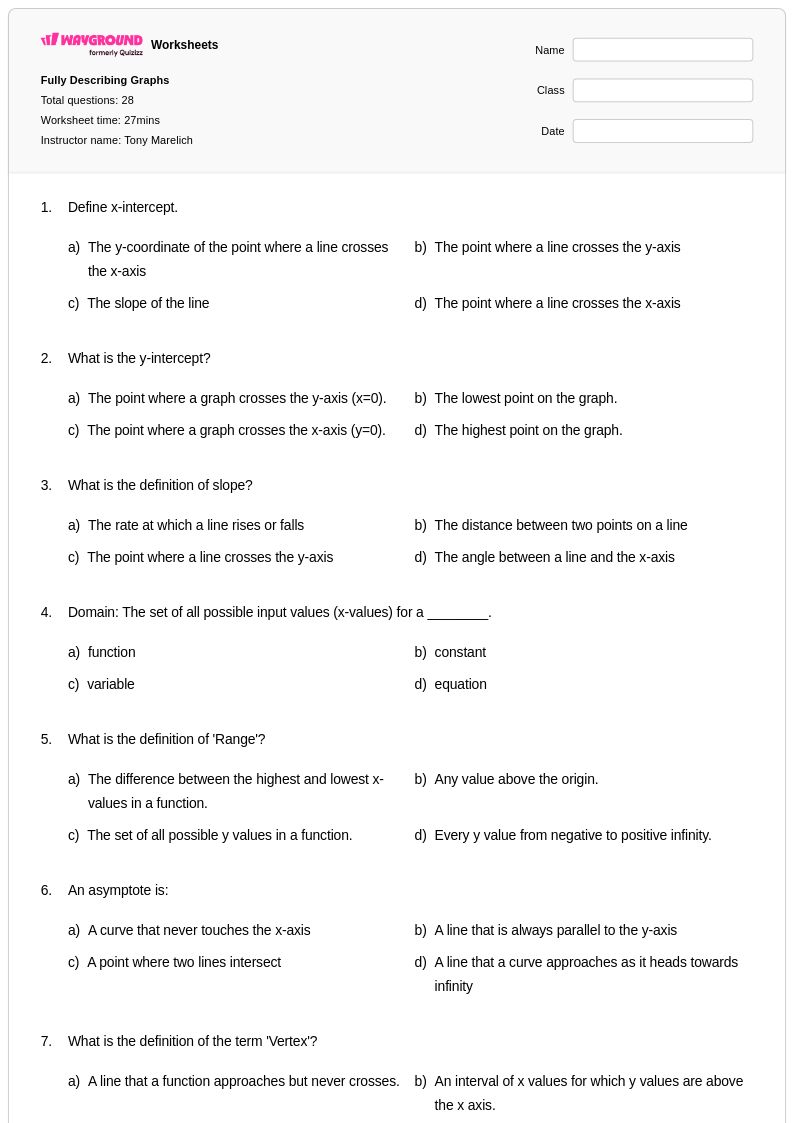
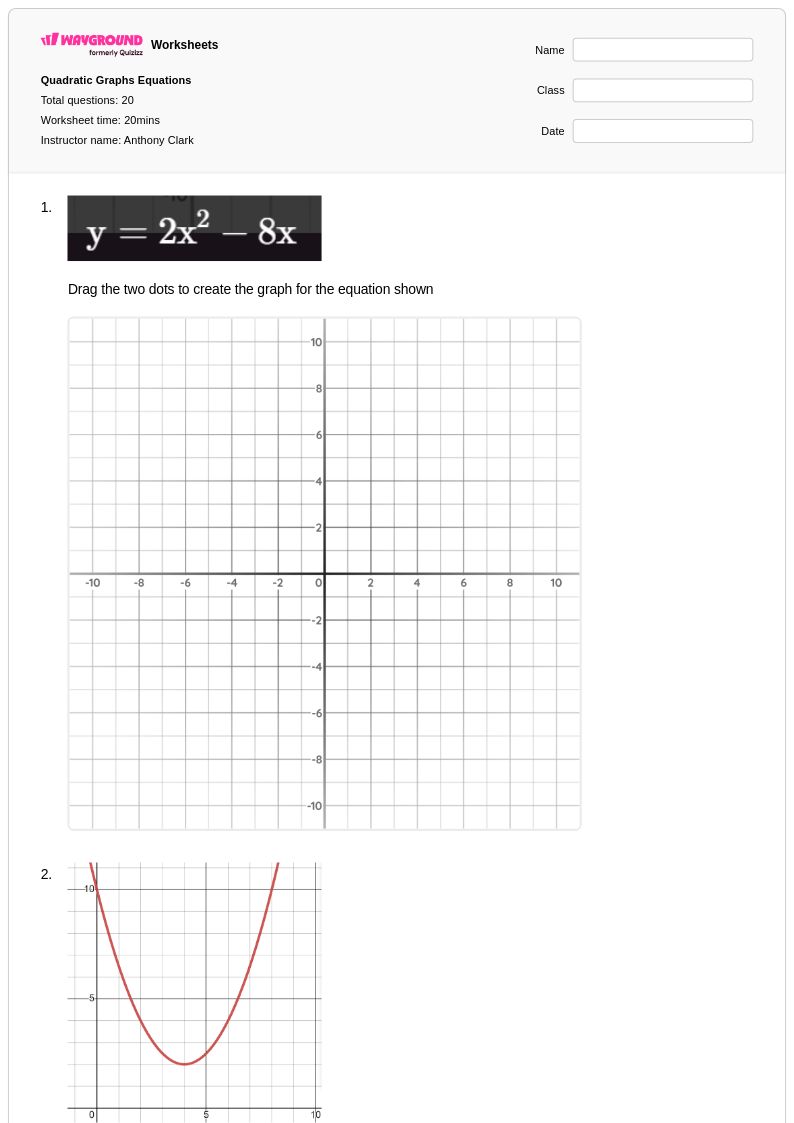
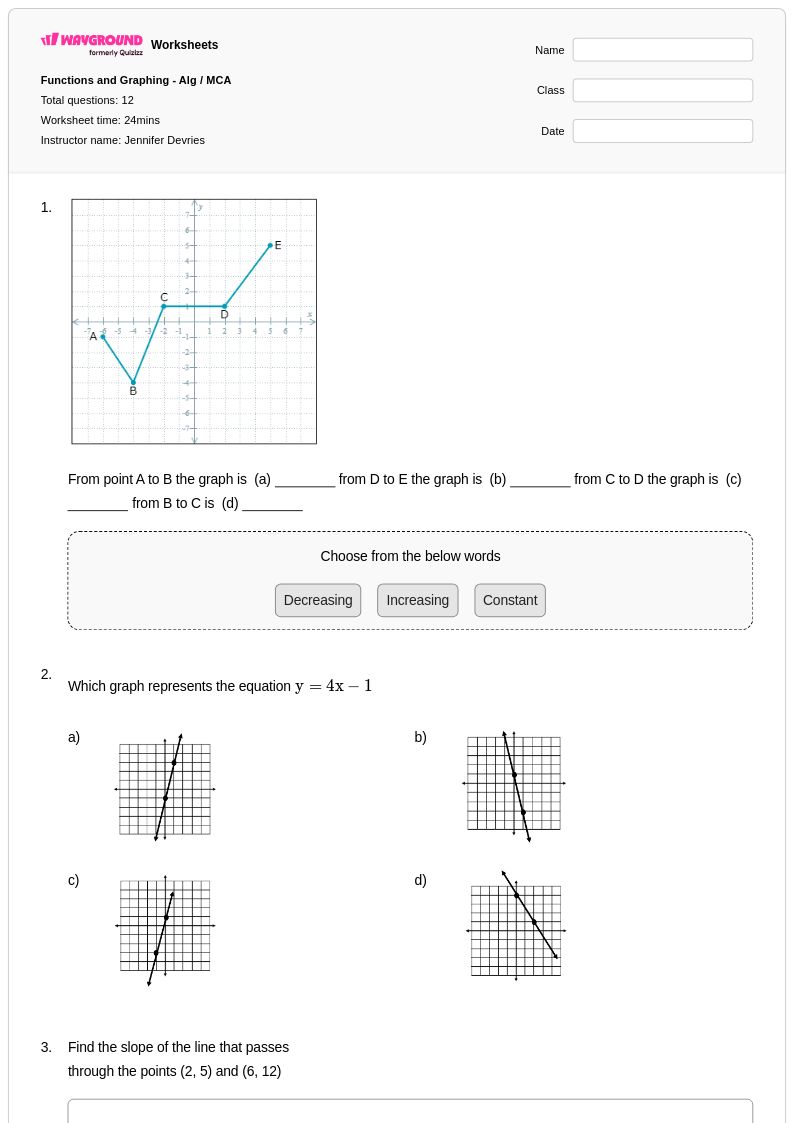
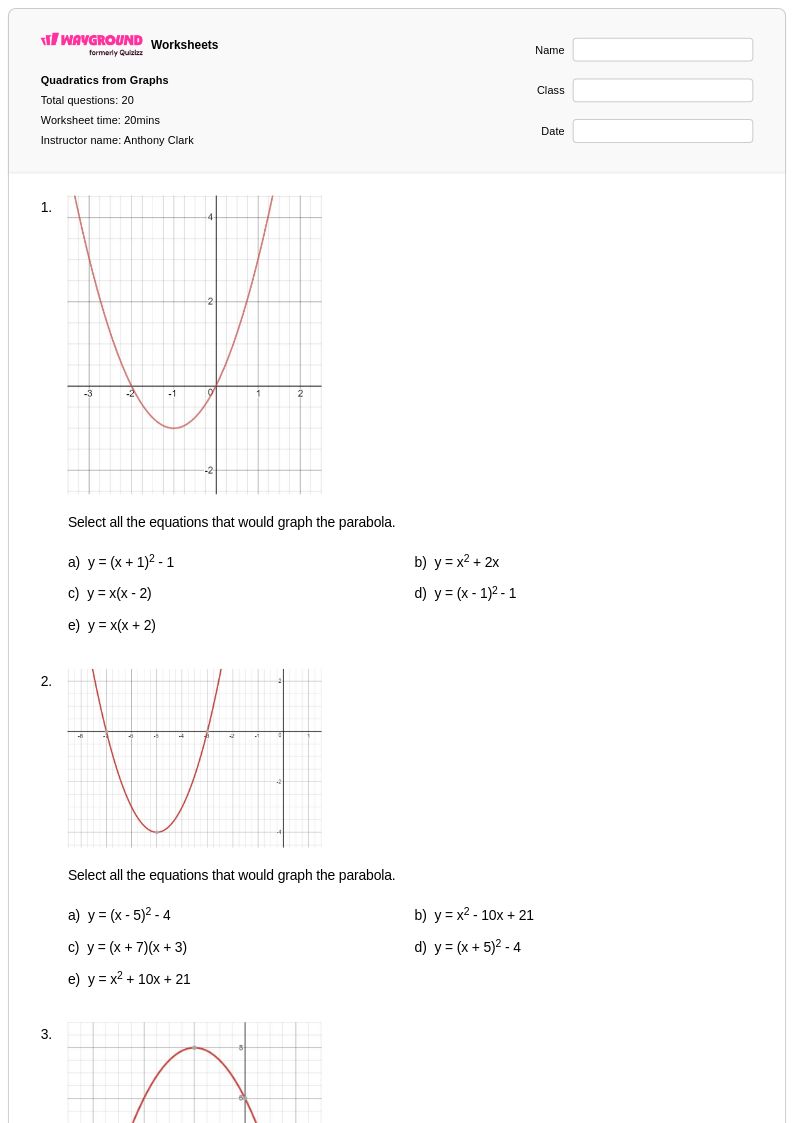
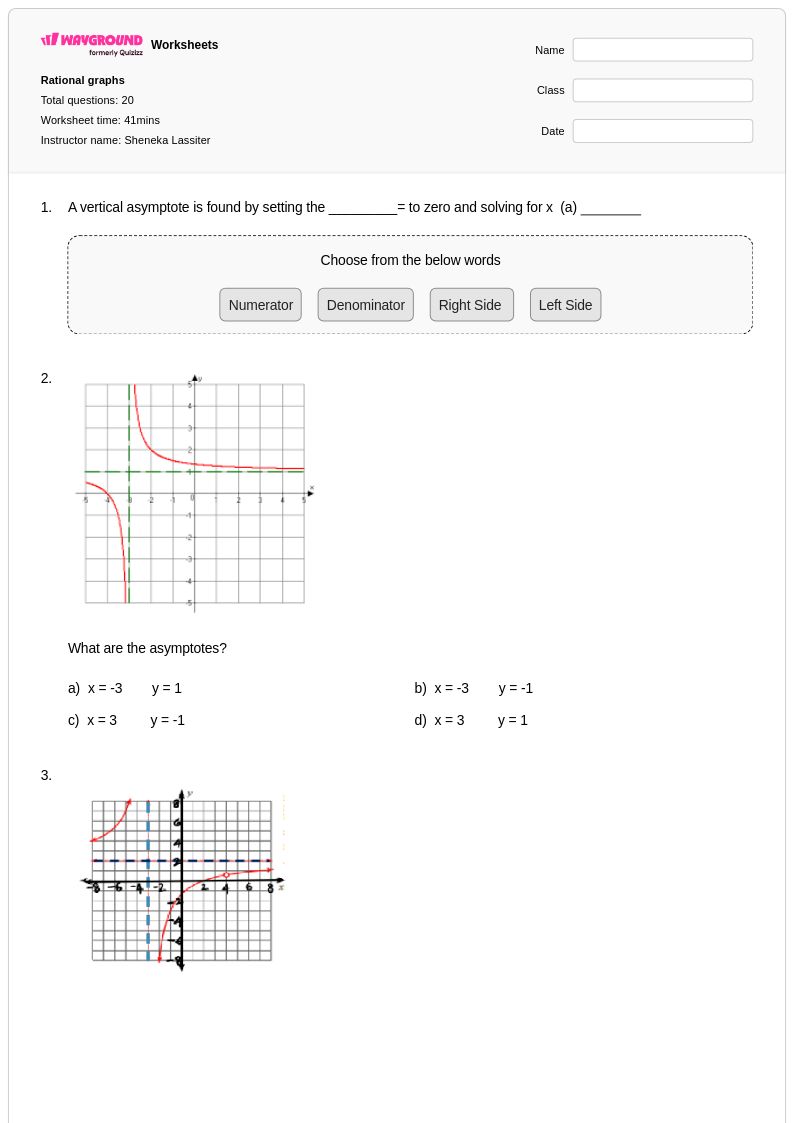
Density graphs represent a crucial concept in Year 12 probability and statistics, requiring students to interpret and analyze continuous probability distributions through visual representations. Wayground's comprehensive collection of density graph worksheets provides students with extensive practice problems that develop their ability to read, construct, and interpret these fundamental statistical tools. These expertly designed printables guide students through essential skills including calculating areas under curves, determining probabilities from density functions, and understanding the relationship between density graphs and cumulative distribution functions. Each worksheet includes a detailed answer key that supports independent learning and helps students verify their understanding of complex probability concepts, while the free pdf format ensures easy access for both classroom instruction and homework assignments.
Wayground, formerly Quizizz, empowers educators with millions of teacher-created resources specifically designed for advanced probability and statistics instruction at the Year 12 level. The platform's robust search and filtering capabilities allow teachers to quickly locate density graph worksheets that align with their curriculum standards and match their students' specific learning needs. These customizable resources support differentiated instruction through multiple difficulty levels and problem types, enabling teachers to provide targeted remediation for struggling students while offering enrichment opportunities for advanced learners. Available in both printable and digital formats including downloadable pdfs, these worksheets streamline lesson planning and provide flexible options for skill practice, assessment preparation, and reinforcement of critical statistical reasoning abilities essential for college-level mathematics.
FAQs
How do I teach density graphs at the Grade 12 level?
By Grade 12, the goal is fluency with density graphs as tools for probabilistic reasoning, not just interpretation. Push students to move between representations: given a density function, sketch the curve; given a curve, write the probability statement for a shaded region; given a probability, find the corresponding boundary value. Problems that require students to construct a density graph from a described scenario, rather than always reading a pre-drawn one, reveal gaps that reading-only practice misses.
What do Grade 12 density graph worksheets cover?
At Grade 12, worksheets typically address: calculating areas under curves for specified probability intervals, working with cumulative distribution functions alongside density functions, determining probabilities for compound events, and interpreting density graphs in the context of statistical inference. Wayground's Grade 12 collection includes problems across these skill areas with complete answer keys, available as printable PDFs or digital assignments.
What are the most common errors Grade 12 students make with density graphs?
Three errors stand out at this level. First, students confuse the density function and the CDF — they'll use a CDF value as if it were a density, or differentiate when they should integrate. Second, when working with non-standard distributions, they default to normal distribution assumptions and apply the empirical rule where it doesn't belong. Third, on multi-step problems, they calculate a correct intermediate probability but then misinterpret what it means in context, losing points on the explanation even when the math is right.
How do I use Wayground's Grade 12 density graph worksheets for exam prep?
For structured exam prep, host the worksheet as a digital quiz on Wayground so students get immediate feedback and you can see which problem types are causing the most errors across the class. For timed practice that mirrors exam conditions, the printable PDF works better — students work on paper without instant feedback, which is closer to the actual test experience. Either way, the included answer key lets you run a targeted debrief focused on the specific errors your class made rather than reviewing every problem.
How do density graphs connect to college-level statistics at Grade 12?
Common Core's high school statistics strand culminates in using probability models to make inferences — and density graphs are the visual foundation for that work. At Grade 12, students should be connecting density curves to sampling distributions: understanding that the distribution of a sample mean is itself a continuous distribution with a density function is what makes the logic of confidence intervals and hypothesis tests coherent. Students who leave Grade 12 able to read and reason from a density graph are prepared for the inferential statistics they'll encounter in AP Statistics, dual enrollment, or first-year college courses.
How can I differentiate Grade 12 density graph practice for students at different readiness levels?
For students who need scaffolding, Wayground lets you create an alternate version of the same worksheet with larger font, wider spacing, or a dyslexia-friendly font — the problems stay identical, just the presentation changes. For students who are ready for more challenge, the platform's filtering tools let you pull problems involving non-standard distributions or multi-step inference scenarios. Extended time can be configured per student for digital assignments, so students who need more processing time get it without any disruption to the rest of the class.