

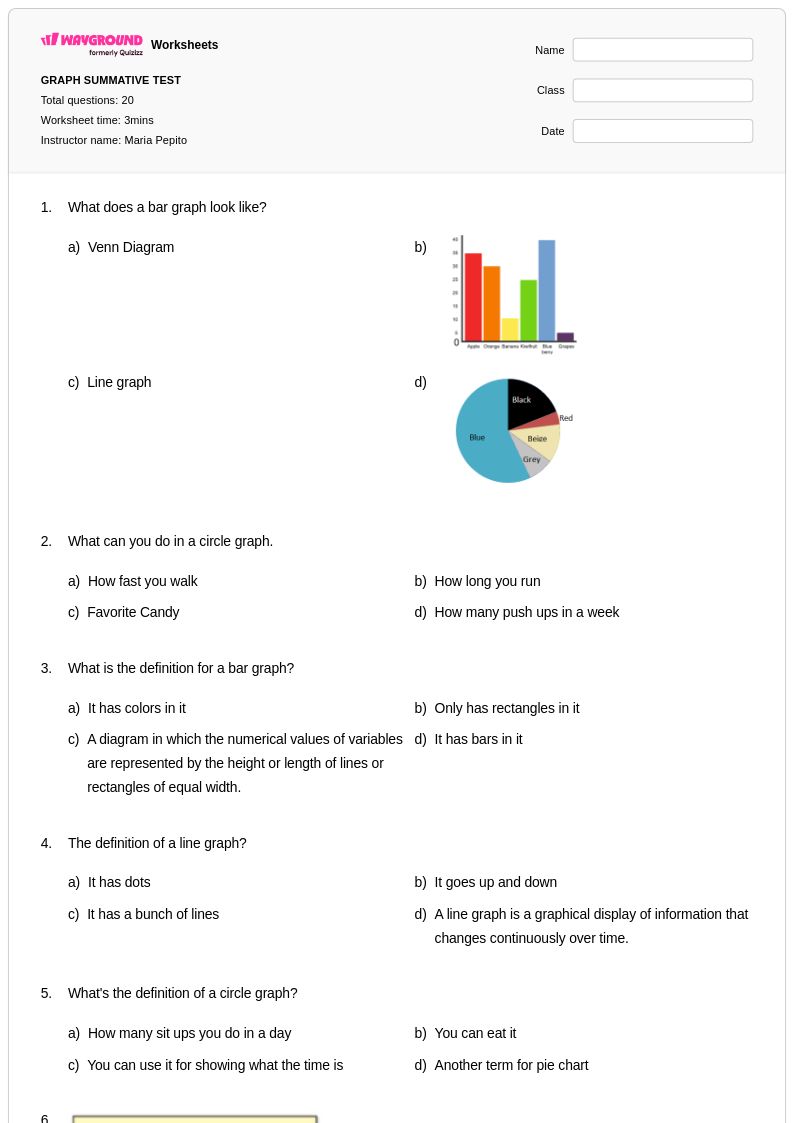
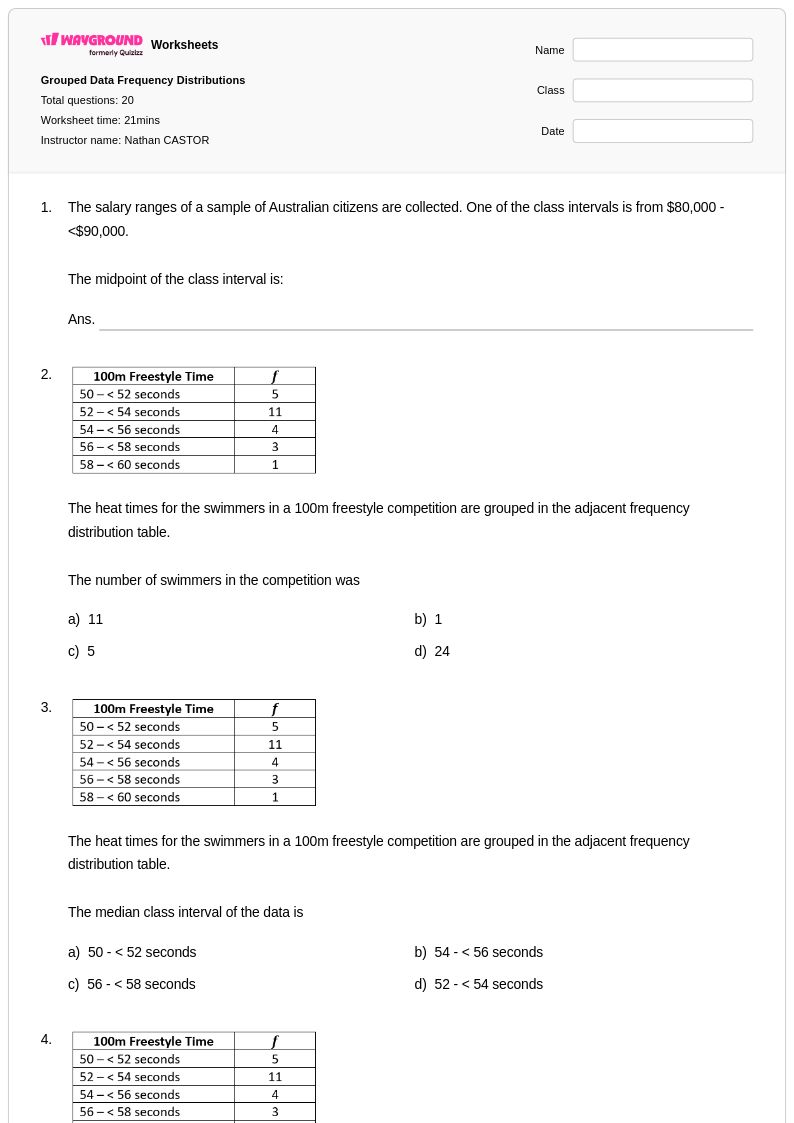
20 Q
6th - Uni
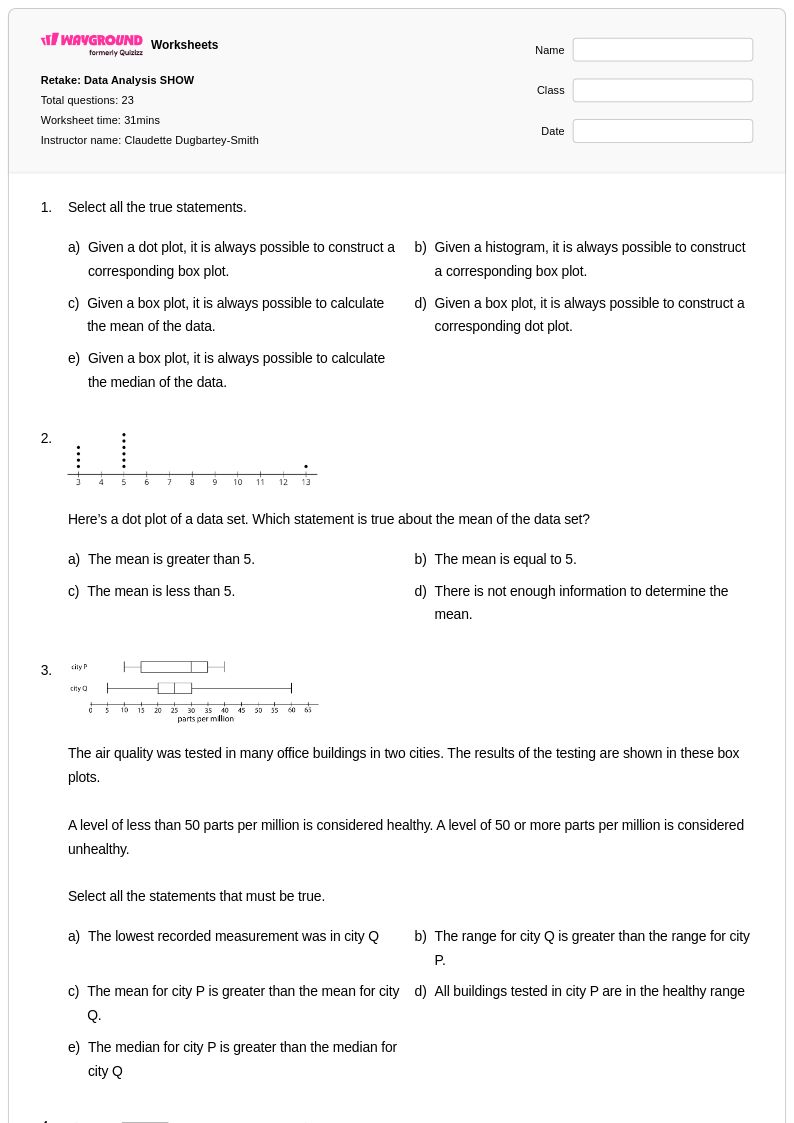
23 Q
6th - 12th
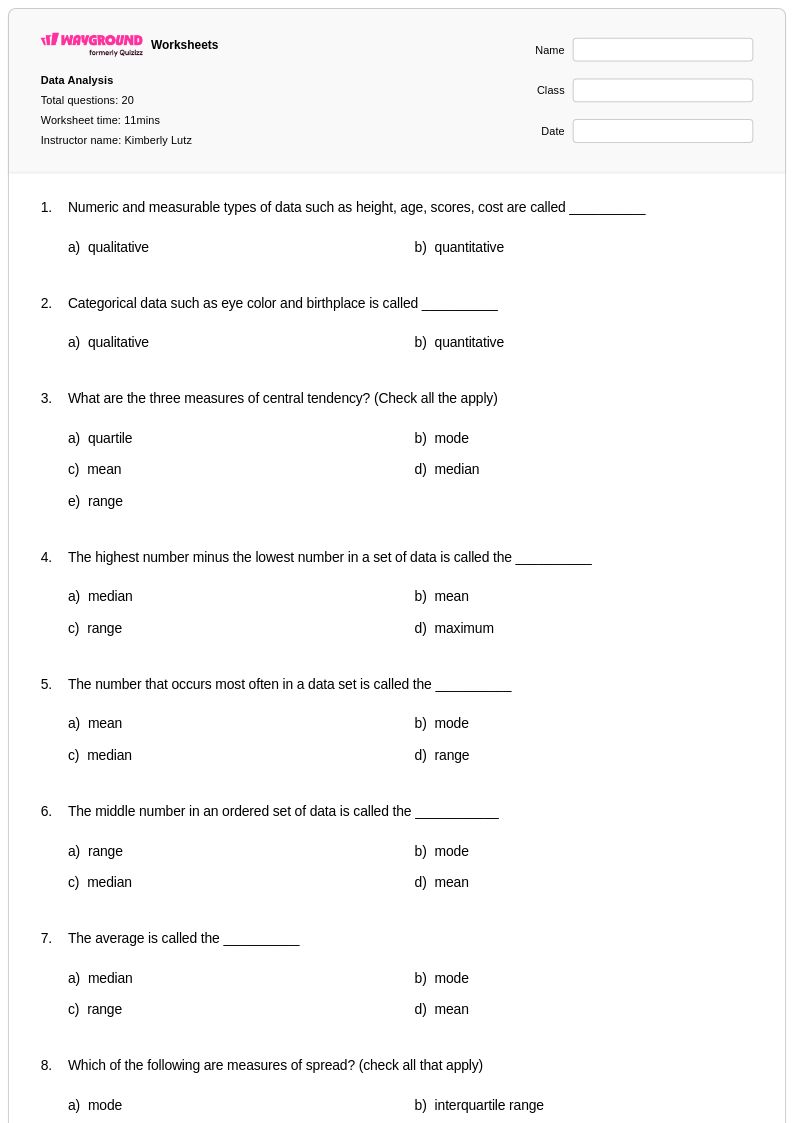
20 Q
6th - Uni
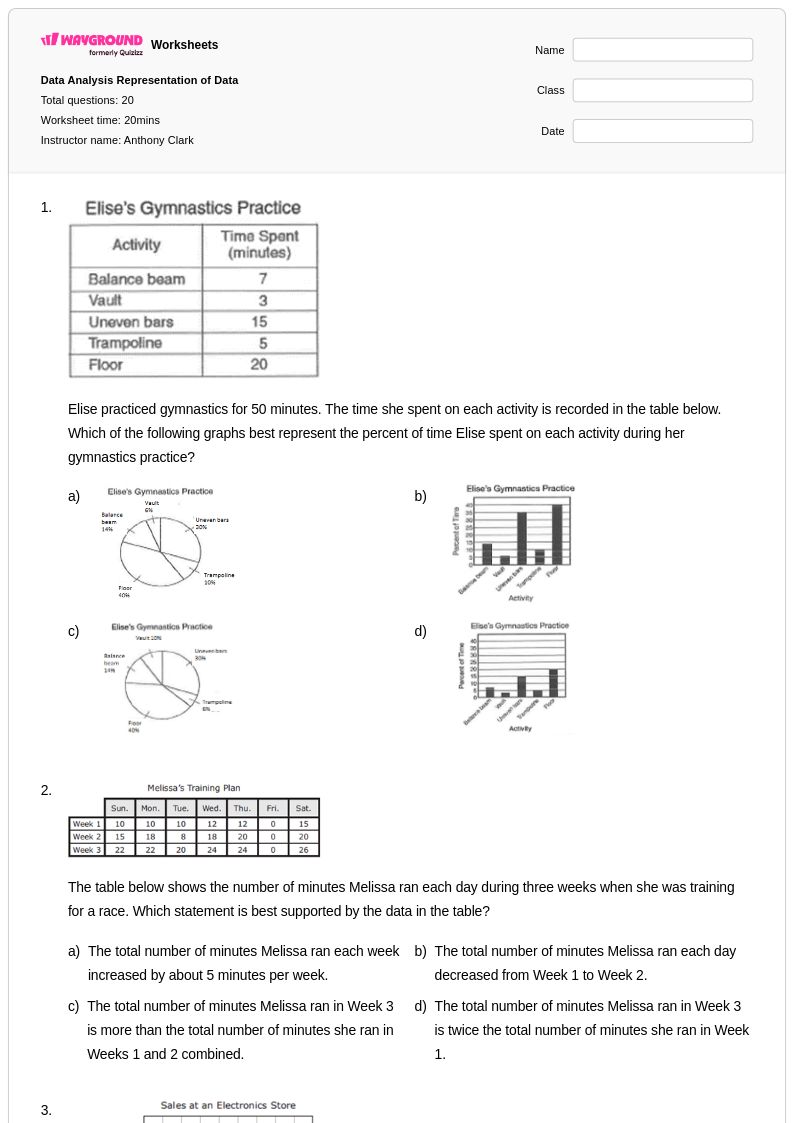
20 Q
9th - 12th
20 Q
7th - Uni
20 Q
9th - Uni
20 Q
9th - Uni
8 Q
8th - Uni
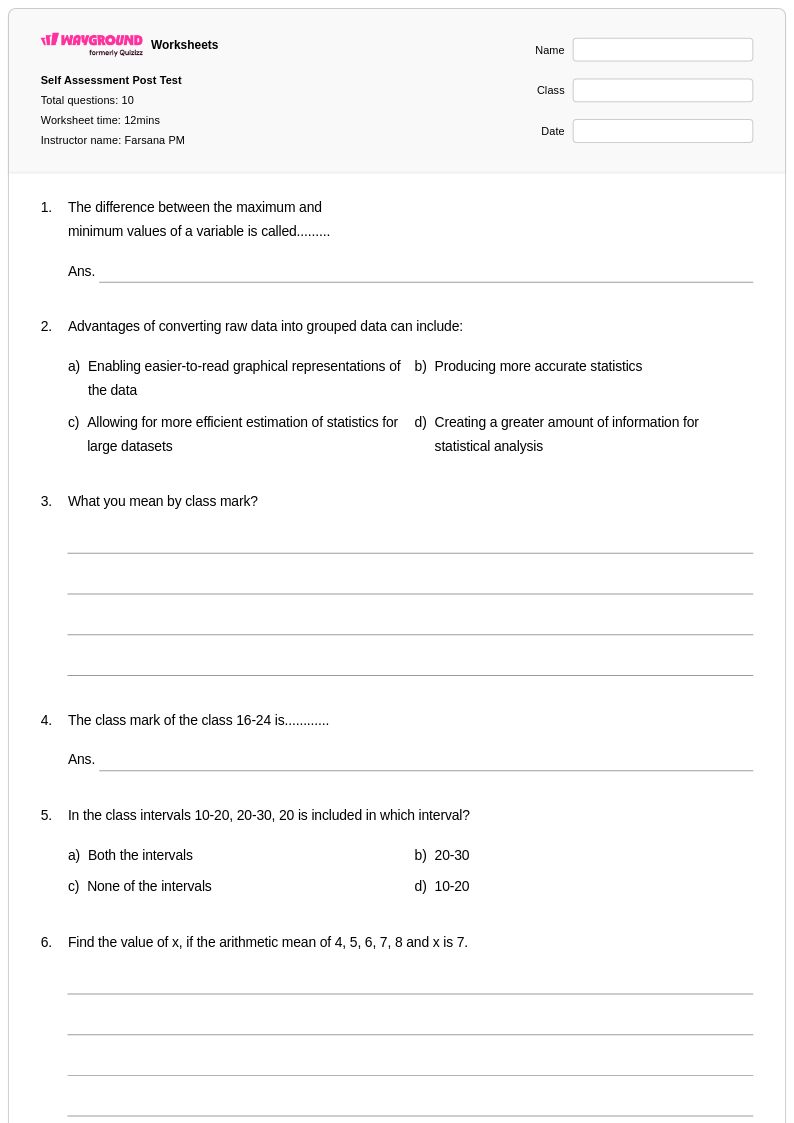
10 Q
9th - 12th
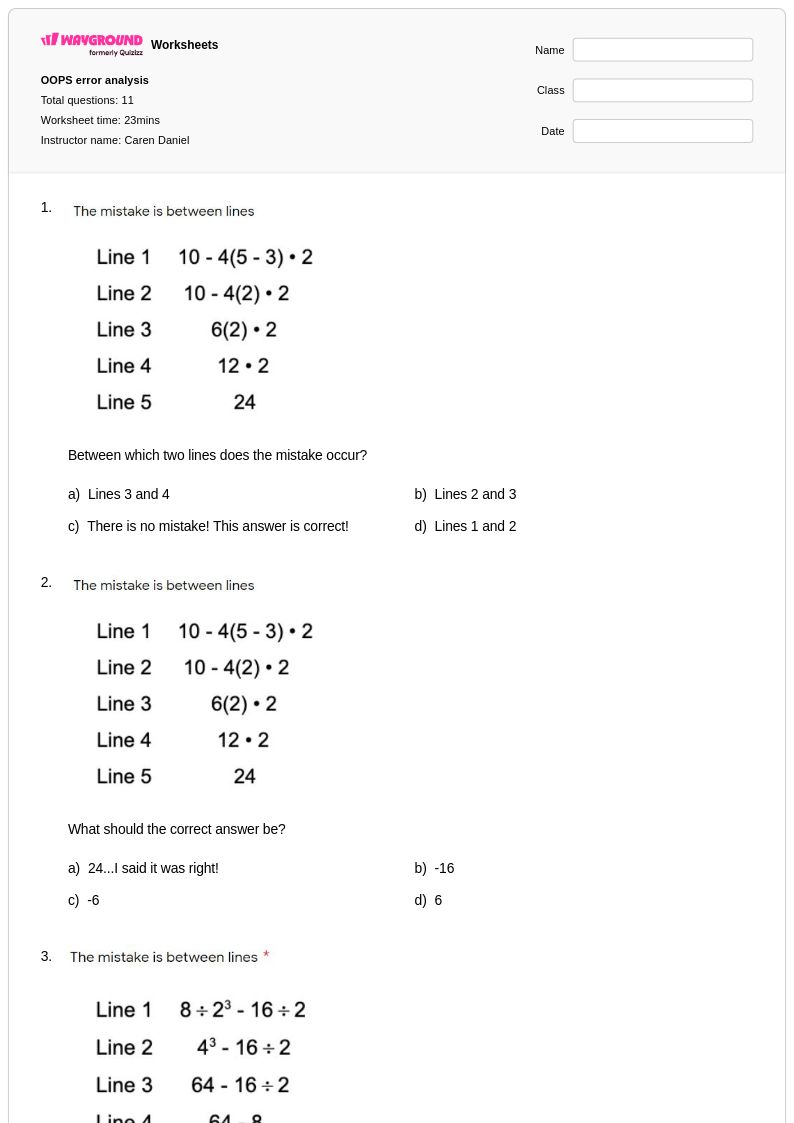
11 Q
7th - 10th
20 Q
9th
10 Q
9th
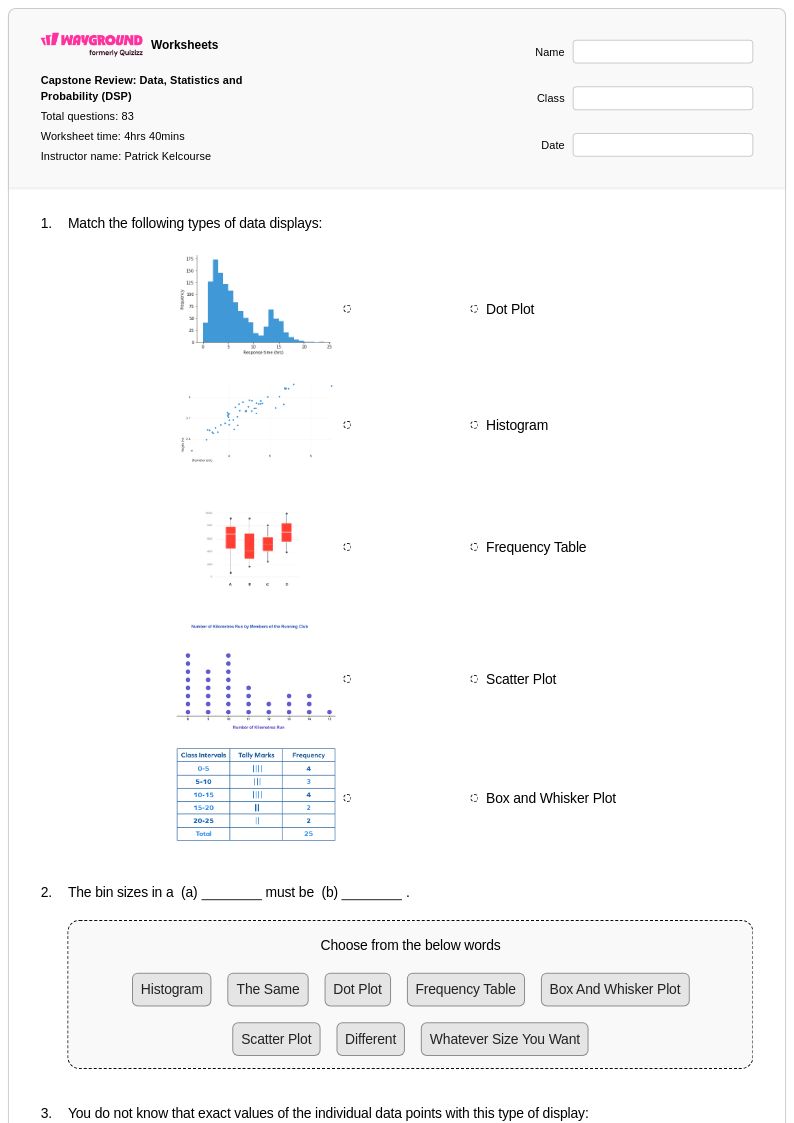
83 Q
9th
20 Q
9th
20 Q
9th - 12th
8 Q
8th - 9th
45 Q
9th - 12th
23 Q
9th
15 Q
9th
15 Q
9th
16 Q
9th
16 Q
9th - 12th

11 Q
6th - 10th
20 Q
8th - 9th
Explore Other Subject Worksheets for year 9
Explore printable Graphical Analysis worksheets for Year 9
Graphical analysis worksheets for Year 9 mathematics through Wayground (formerly Quizizz) provide comprehensive practice in interpreting, analyzing, and drawing conclusions from various types of graphs and data representations. These carefully structured resources help students develop critical thinking skills essential for understanding scatter plots, line graphs, bar charts, histograms, and box plots while strengthening their ability to identify trends, correlations, and outliers in data sets. Each worksheet includes detailed practice problems that guide students through the process of reading graph scales, calculating slopes, determining correlation coefficients, and making predictions based on graphical data, with complete answer keys provided to support both independent study and classroom instruction. These free printable resources in PDF format ensure students can access high-quality materials that build foundational skills in statistical reasoning and data interpretation required for advanced mathematics courses.
Wayground (formerly Quizizz) empowers educators with millions of teacher-created graphical analysis worksheet collections that feature robust search and filtering capabilities, allowing instructors to quickly locate materials aligned with specific curriculum standards and learning objectives. The platform's differentiation tools enable teachers to customize worksheets based on individual student needs, offering both remediation support for struggling learners and enrichment opportunities for advanced students ready to tackle complex data analysis challenges. Available in both printable and digital PDF formats, these versatile resources integrate seamlessly into lesson planning workflows, providing flexible options for in-class instruction, homework assignments, and assessment preparation. Teachers can efficiently organize skill practice sessions, create targeted intervention materials, and develop comprehensive review packets that address the full spectrum of graphical analysis concepts essential for Year 9 mathematics success.