
20 Q
9th - Uni
15 Q
9th - Uni
14 Q
9th - Uni
9 Q
7th - Uni
17 Q
9th - Uni
20 Q
9th - Uni
15 Q
9th - Uni
15 Q
9th - Uni
16 Q
8th - Uni
15 Q
8th - Uni
20 Q
9th - 12th
19 Q
4th - Uni
15 Q
10th - Uni
20 Q
9th - 12th
20 Q
9th - Uni
20 Q
9th - Uni
19 Q
9th - Uni
20 Q
7th - Uni
20 Q
8th - Uni
12 Q
9th - Uni
20 Q
7th - Uni
13 Q
9th - Uni
20 Q
7th - Uni
20 Q
10th - Uni
Explore Graphing Real World Applications Worksheets by Grades
Explore Other Subject Worksheets for year 12
Explore printable Graphing Real World Applications worksheets for Year 12
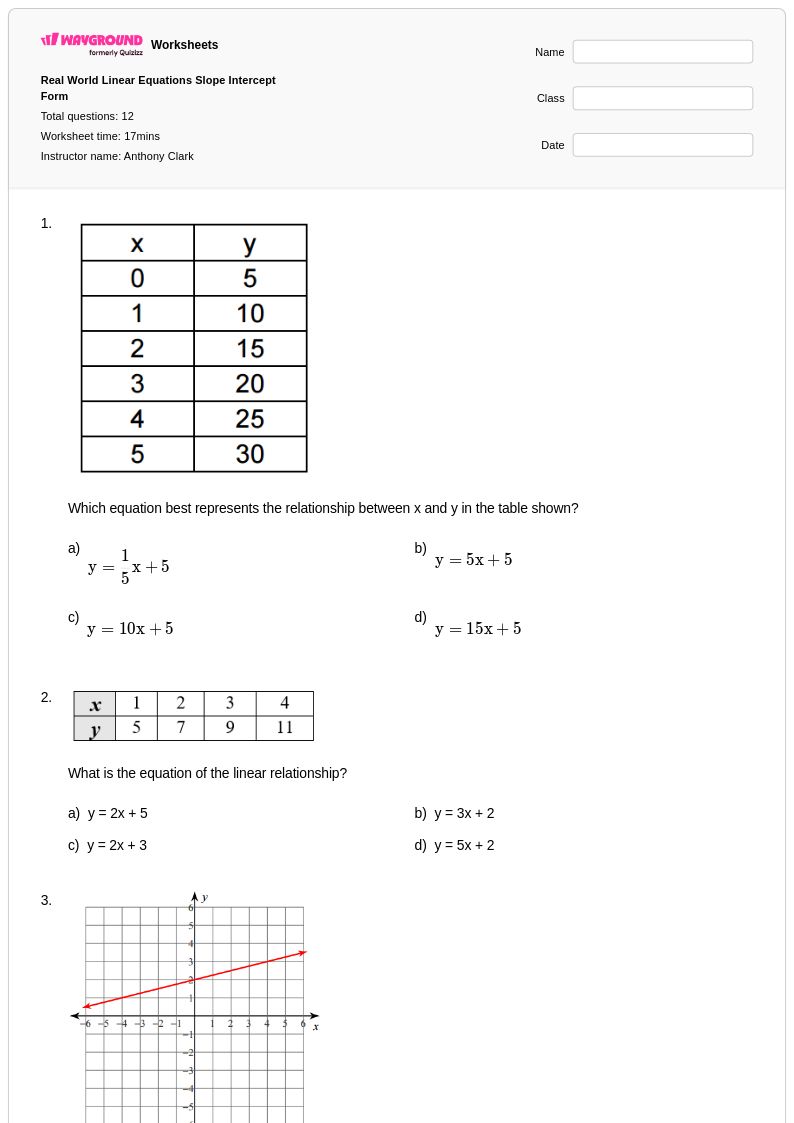
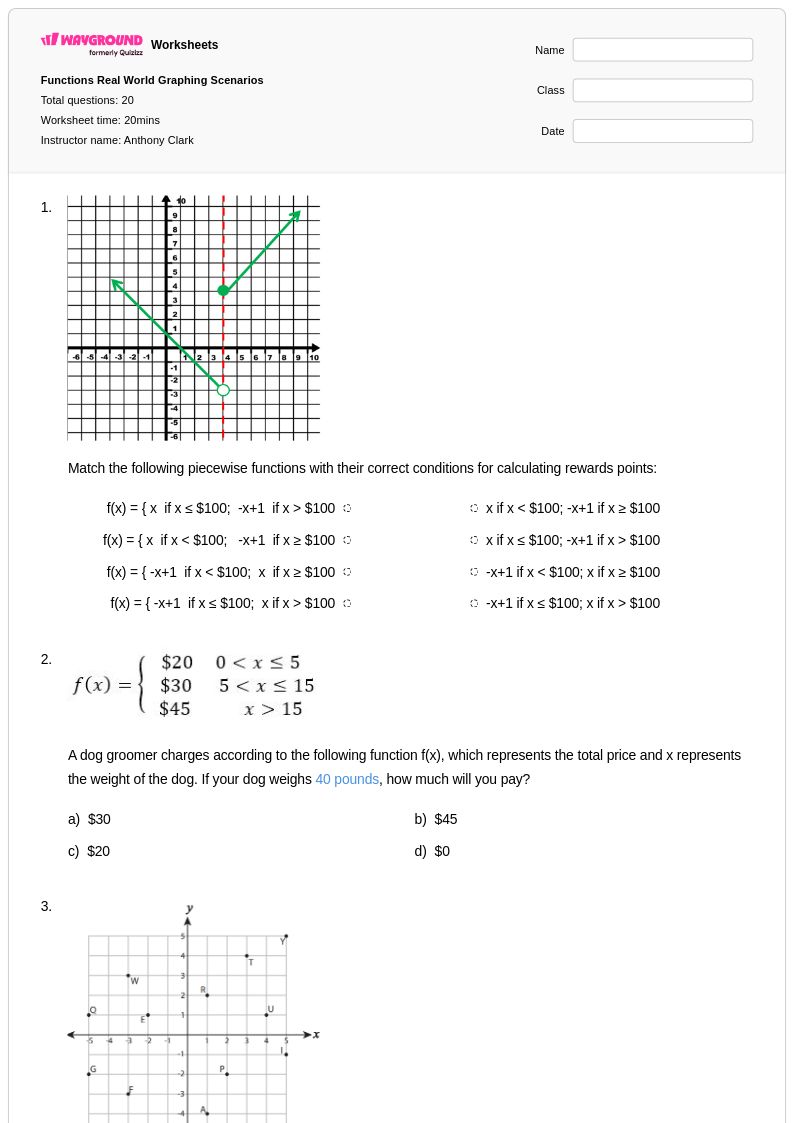
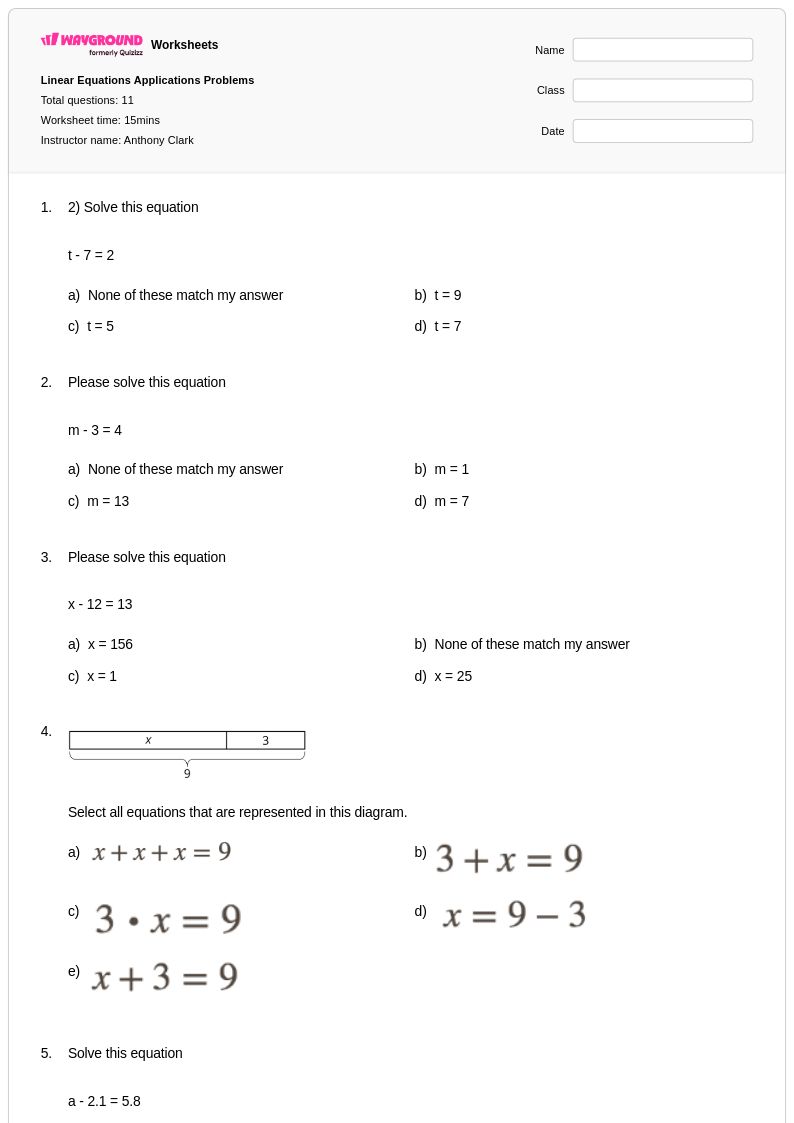
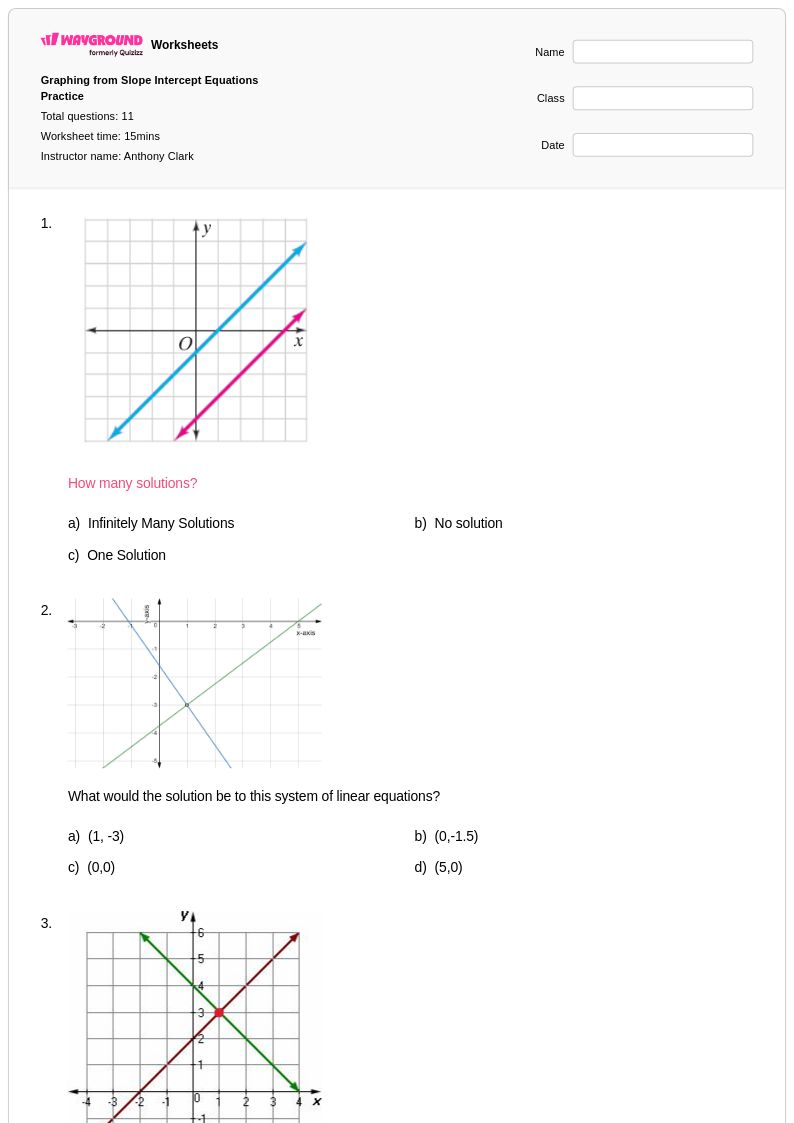
Graphing real world applications represents a crucial component of Year 12 mathematics education, where students bridge abstract mathematical concepts with practical, everyday scenarios. Wayground's comprehensive collection of worksheets focuses specifically on helping students master the art of translating real-world data into meaningful visual representations, including linear and nonlinear relationships, exponential growth and decay models, and statistical distributions found in business, science, and social contexts. These carefully crafted practice problems challenge students to interpret complex datasets, create appropriate graphical displays, and analyze trends that mirror situations they might encounter in college coursework or professional environments. Each worksheet comes complete with a detailed answer key and is available as a free printable pdf, ensuring students can work through problems systematically while teachers can efficiently assess understanding and provide targeted feedback on this essential mathematical skill.
Wayground's platform, formerly Quizizz, empowers educators with millions of teacher-created resources specifically designed to support graphing real world applications instruction at the Year 12 level. The robust search and filtering capabilities allow teachers to quickly locate worksheets that align with specific curriculum standards and match their students' diverse learning needs, whether for initial skill introduction, remediation support, or advanced enrichment opportunities. Teachers can seamlessly customize existing materials or create entirely new worksheet collections, with flexible options for both digital classroom integration and traditional printable pdf formats. This comprehensive approach to differentiation ensures that every student receives appropriately challenging practice with real-world graphing scenarios, while the platform's organizational tools streamline lesson planning and help educators track student progress across multiple mathematical applications and skill areas.