
20 Q
6th - 8th
20 Q
4th - Uni
20 Q
6th - Uni
20 Q
6th - 8th
20 Q
6th - 8th
20 Q
6th
20 Q
5th - Uni
15 Q
6th
20 Q
6th - Uni
20 Q
6th - Uni
11 Q
6th
13 Q
6th - 8th
14 Q
6th - Uni
20 Q
4th - Uni
20 Q
6th - Uni
20 Q
6th
75 Q
6th
15 Q
6th - Uni
15 Q
6th
25 Q
6th
11 Q
6th - Uni
41 Q
6th
14 Q
6th - 8th
20 Q
5th - Uni
Explore Other Subject Worksheets for year 6
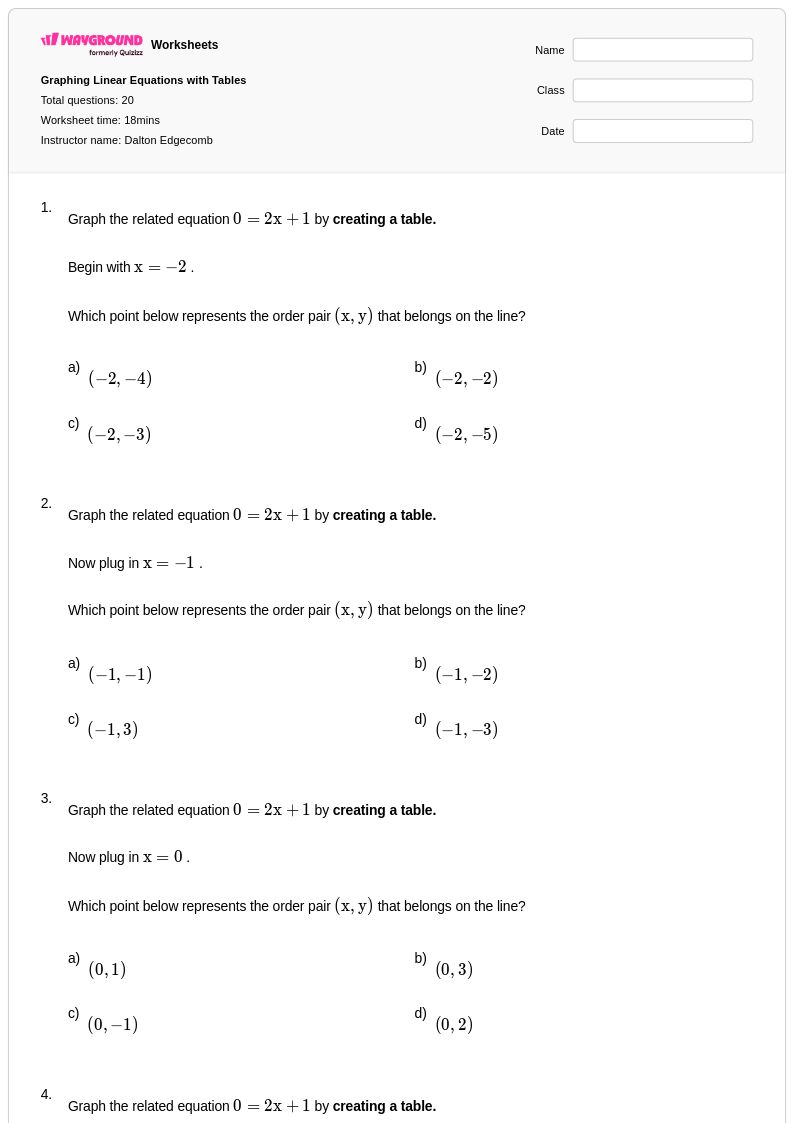
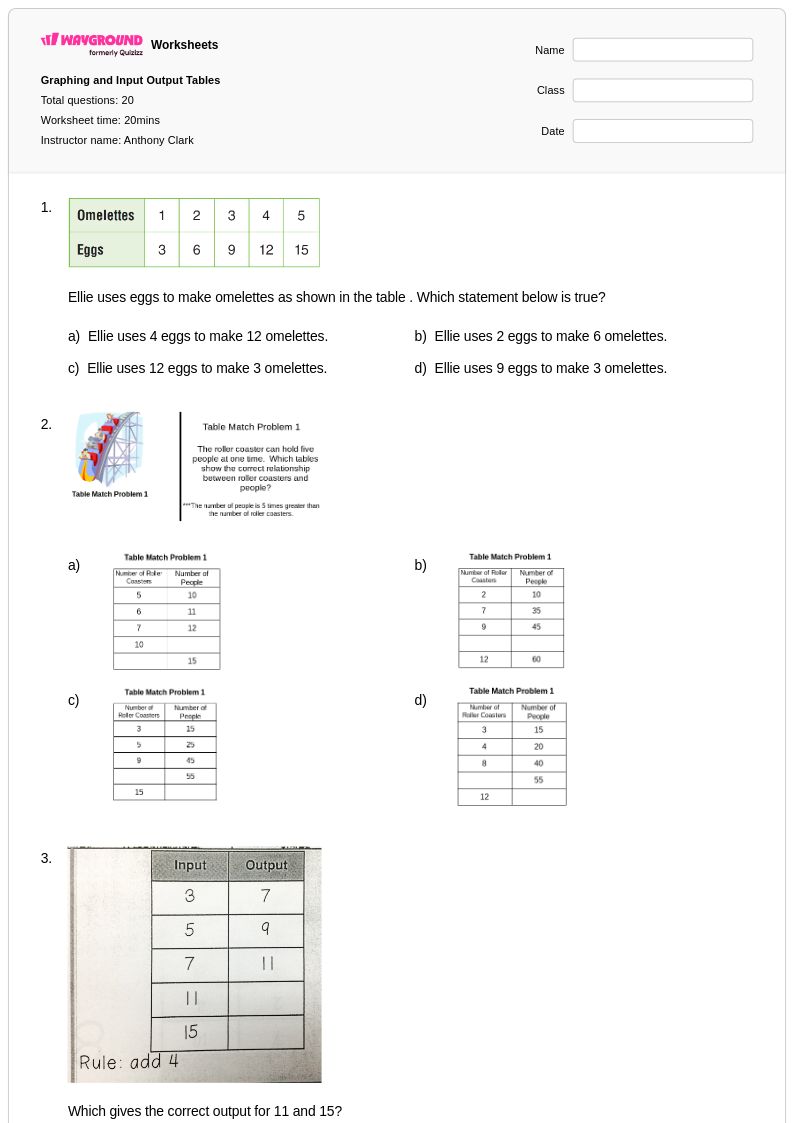
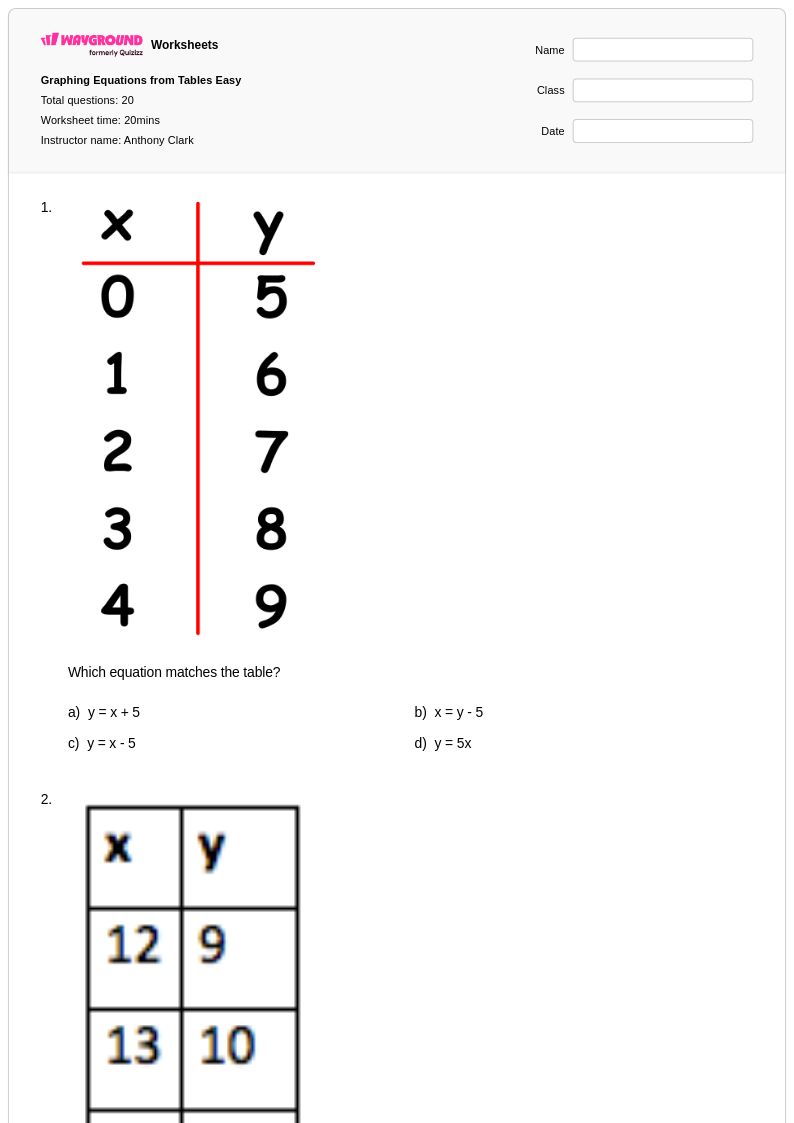
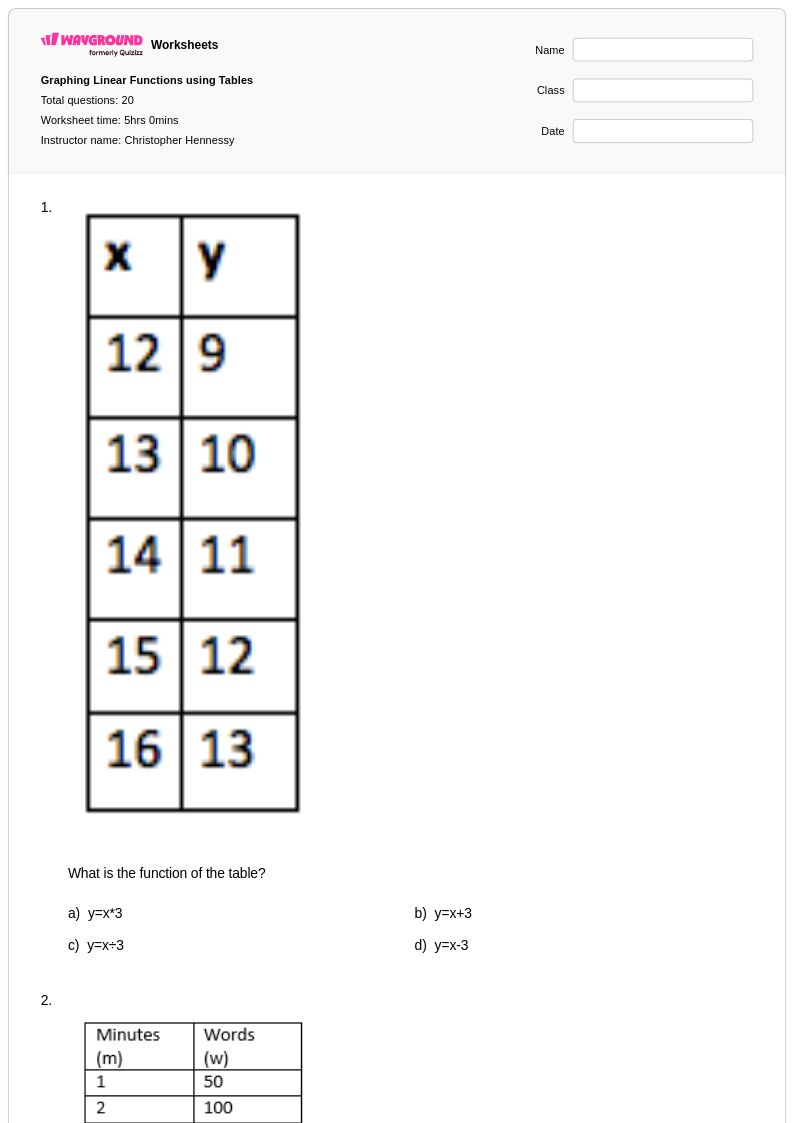
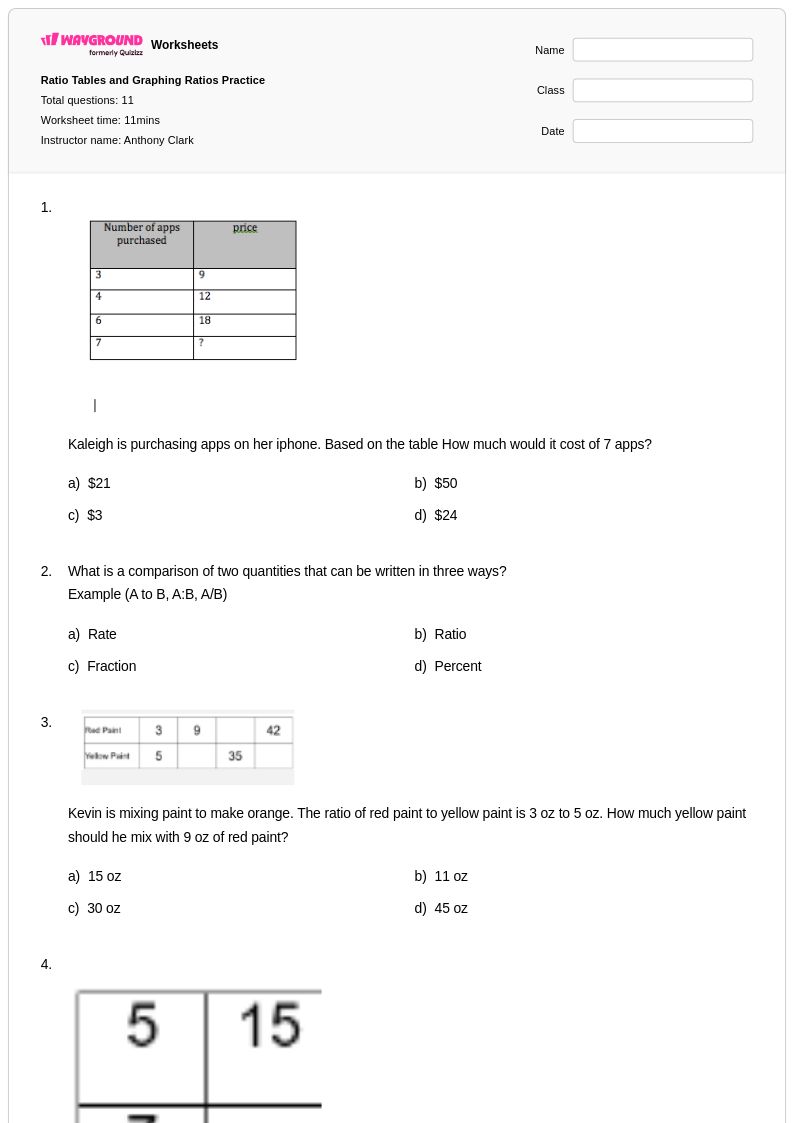
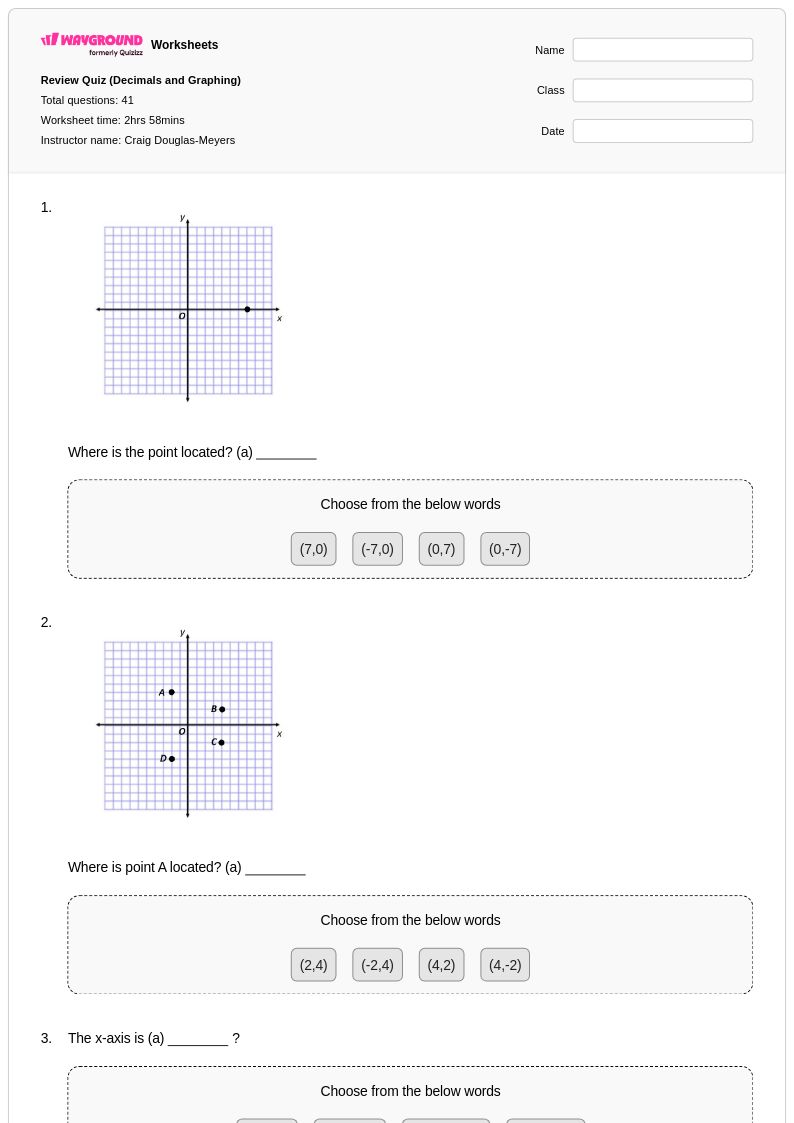
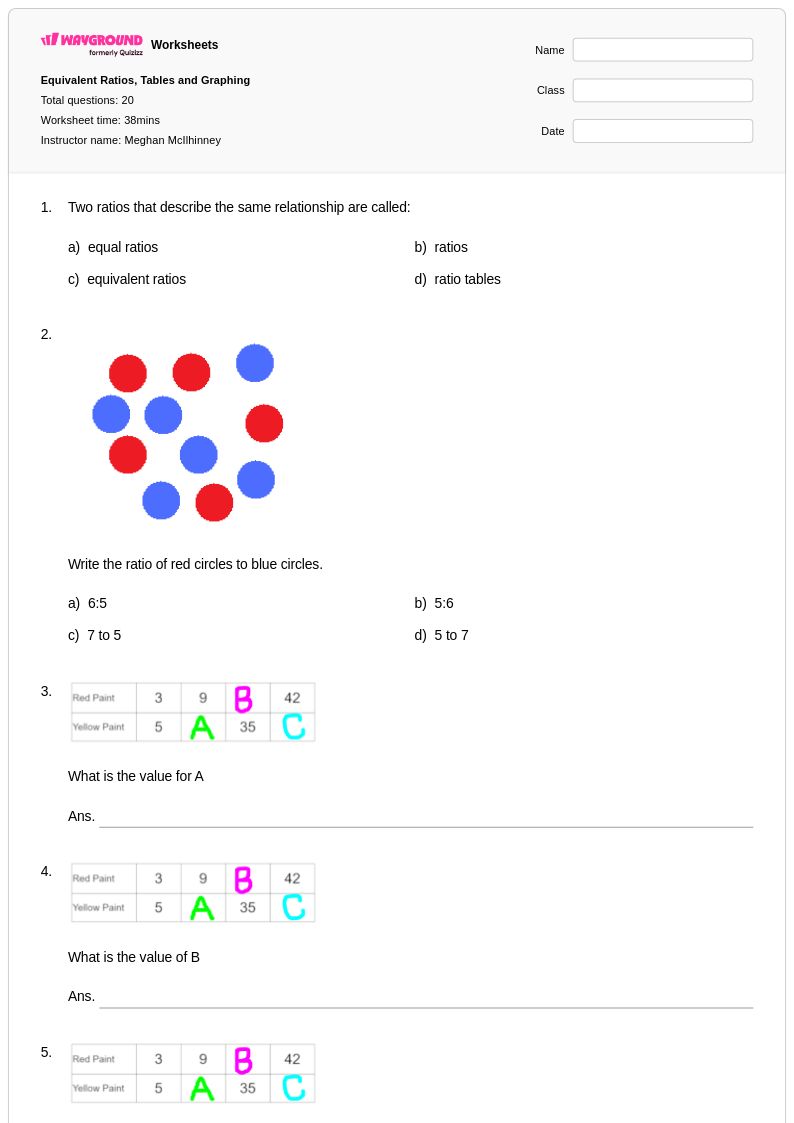
Explore printable Graphing with Tables worksheets for Year 6
Graphing with tables worksheets for Year 6 students available through Wayground provide essential practice in translating numerical data into visual representations, a fundamental skill that bridges algebraic thinking and statistical literacy. These comprehensive worksheets guide students through the systematic process of organizing data points, identifying patterns in table format, and accurately plotting coordinates on various graph types including line graphs, bar charts, and coordinate planes. Students develop critical analytical skills as they work through practice problems that require them to interpret table values, determine appropriate scales, and create clear visual displays of mathematical relationships. Each worksheet collection includes detailed answer keys and is available as free printable PDF resources, enabling educators to seamlessly integrate structured graphing practice into their mathematics curriculum.
Wayground (formerly Quizizz) empowers teachers with an extensive library of millions of teacher-created graphing with tables resources specifically designed for Year 6 mathematics instruction. The platform's robust search and filtering capabilities allow educators to quickly locate worksheets aligned with specific learning standards and differentiate instruction based on individual student needs. Teachers can customize existing materials or create entirely new worksheet collections, with flexible options for both printable PDF formats and interactive digital assignments that accommodate diverse classroom environments. These versatile resources support comprehensive lesson planning by providing targeted practice for skill remediation, enrichment activities for advanced learners, and ongoing assessment tools that help teachers monitor student progress in data representation and graphical analysis throughout the academic year.