
28 Q
9th - 12th
20 Q
9th - Uni
10 Q
9th - 11th
10 Q
10th - Uni
15 Q
9th - Uni
25 Q
11th - Uni
14 Q
8th - 12th
25 Q
9th - 12th
15 Q
6th - Uni
20 Q
9th - Uni
16 Q
9th - 12th
18 Q
9th - 12th
8 Q
8th - 12th
7 Q
7th - 12th
20 Q
10th - Uni
10 Q
9th - 11th
19 Q
8th - 12th
9 Q
6th - Uni
23 Q
11th - 12th
6 Q
9th - 12th
20 Q
10th - 11th
20 Q
9th - Uni
9 Q
9th - Uni
Explore Other Subject Worksheets for year 11
Explore printable Histograms worksheets for Year 11
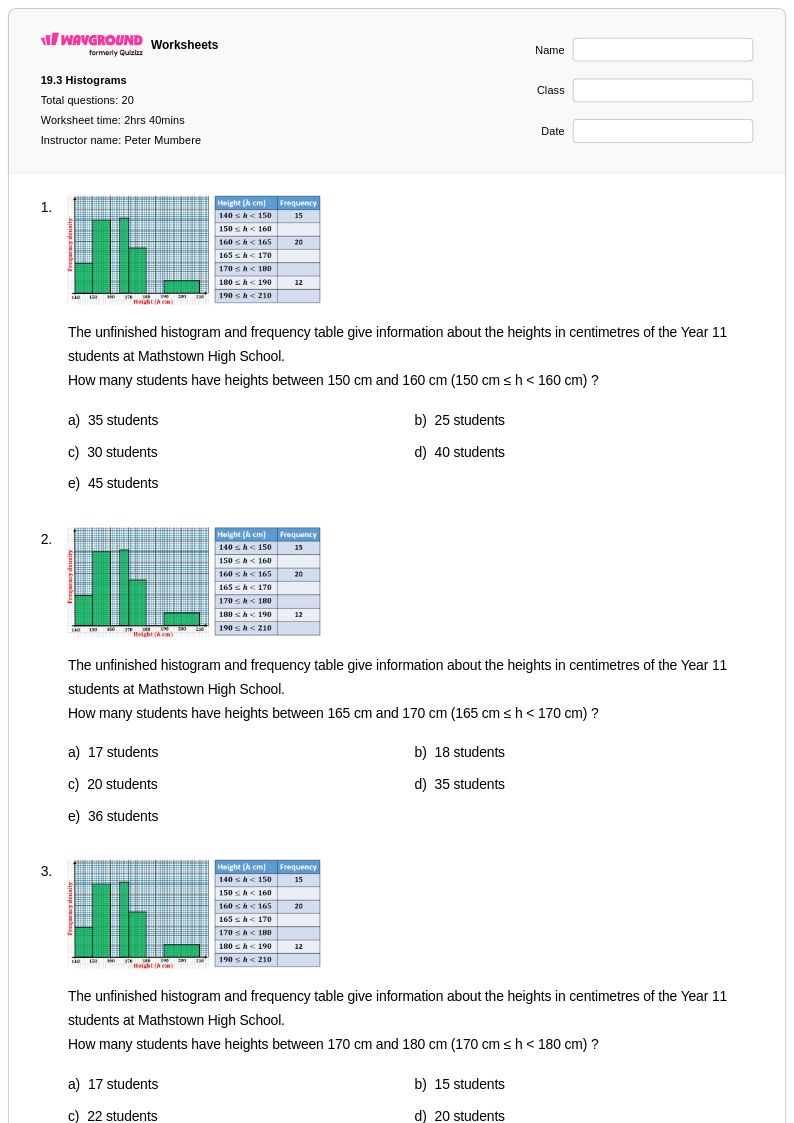
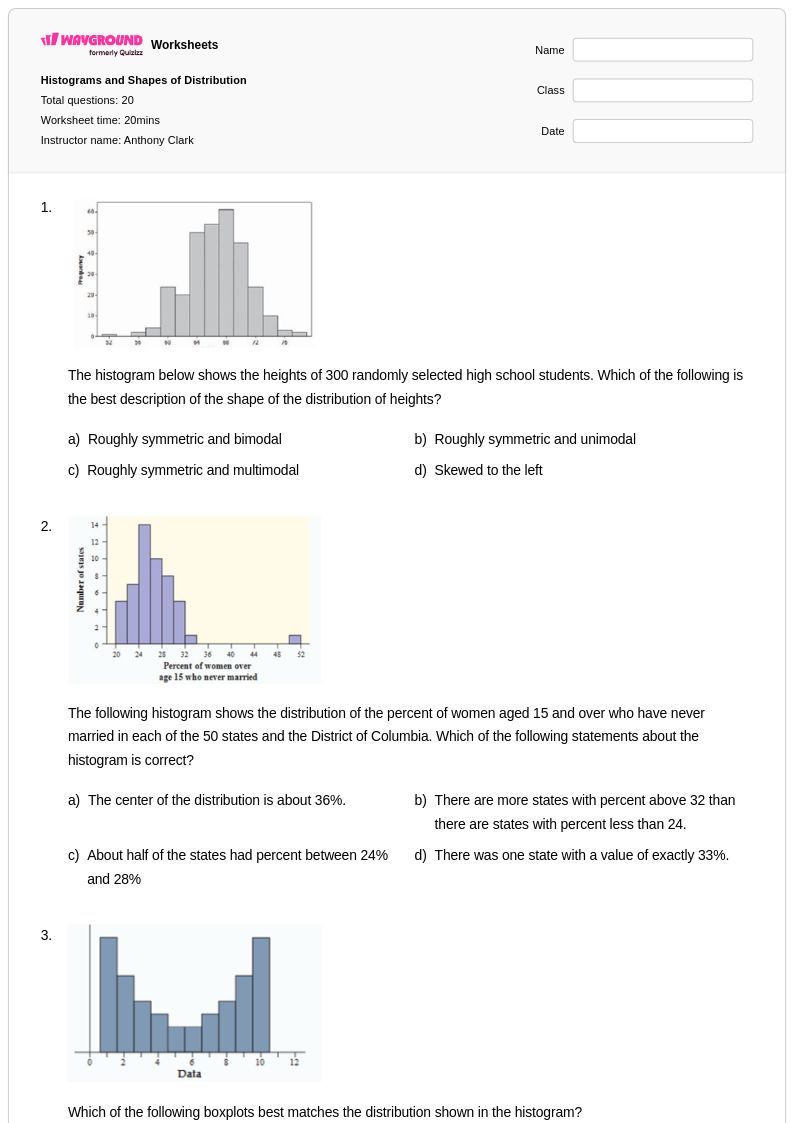
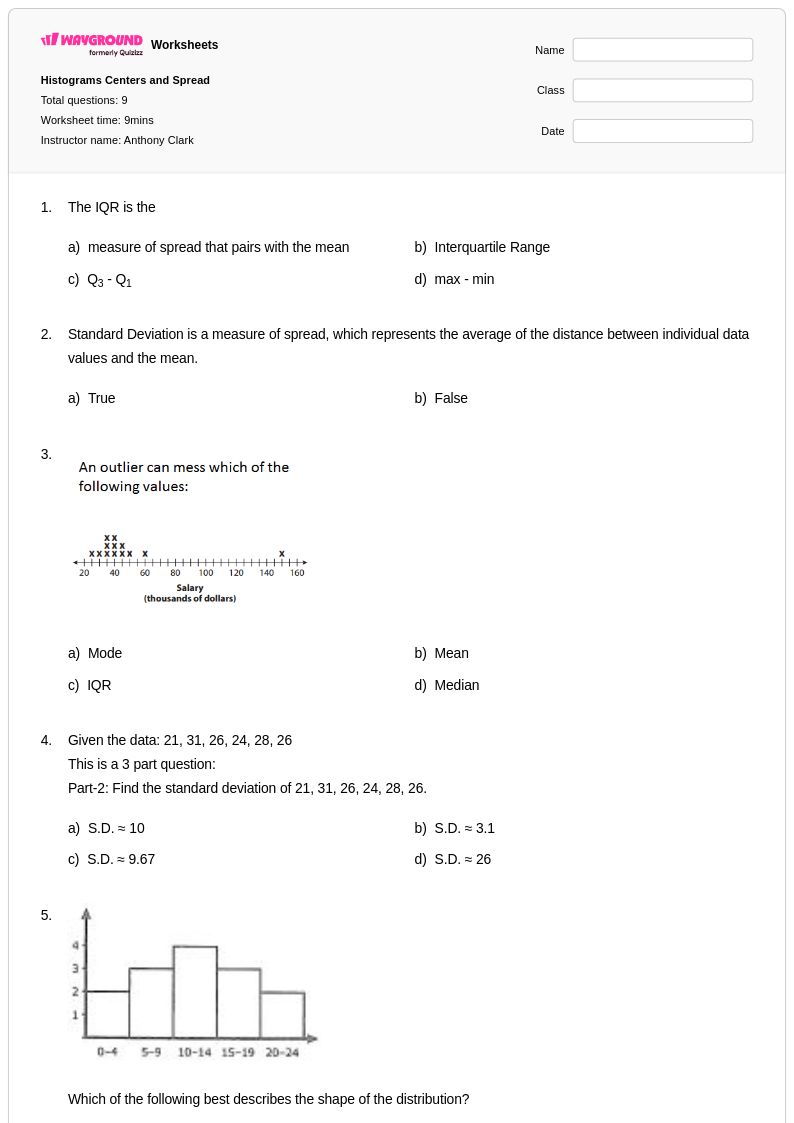
Histograms serve as a fundamental tool for Year 11 students to visualize and analyze frequency distributions in mathematics, and Wayground's comprehensive worksheet collection provides extensive practice opportunities for mastering this essential data representation skill. These carefully crafted worksheets guide students through constructing histograms from raw data sets, interpreting bin widths and frequencies, analyzing distribution shapes, and drawing meaningful conclusions from graphical displays. Students develop critical analytical skills as they work through practice problems that range from basic histogram construction to advanced interpretation tasks involving skewness, modality, and comparative analysis. Each worksheet comes with a detailed answer key to support independent learning and self-assessment, while the free printable pdf format ensures accessibility for both classroom instruction and home study sessions.
Wayground (formerly Quizizz) empowers educators with millions of teacher-created histogram worksheets that can be easily discovered through robust search and filtering capabilities, allowing instructors to quickly locate materials aligned with specific curriculum standards and learning objectives. The platform's differentiation tools enable teachers to customize worksheet difficulty levels, modify data sets, and adjust problem complexity to meet diverse student needs within the same Year 11 classroom. Whether delivered as printable pdf handouts for traditional practice or deployed digitally for interactive learning experiences, these histogram resources support comprehensive lesson planning while providing targeted materials for remediation and enrichment activities. Teachers can seamlessly integrate these worksheets into their data analysis units, using the flexible format options to create cohesive learning sequences that build student confidence in interpreting and creating histograms across various mathematical contexts.