 Worksheets
Data Analysis and Graphing
Total questions: 10
Name
Class
Date


 Answer Key
Data Analysis and Graphing
Total questions: 10
1.
c)
7.1 seconds
2.
b)
11
3.
d)
7
4.
b)
1
5.
d)
0-80
6.
d)
10
7.
c)
40
8.
d)
12
9.
b)
2
10.
c)
400lbs

10 questions
5th - 5th Grade
Mathematics
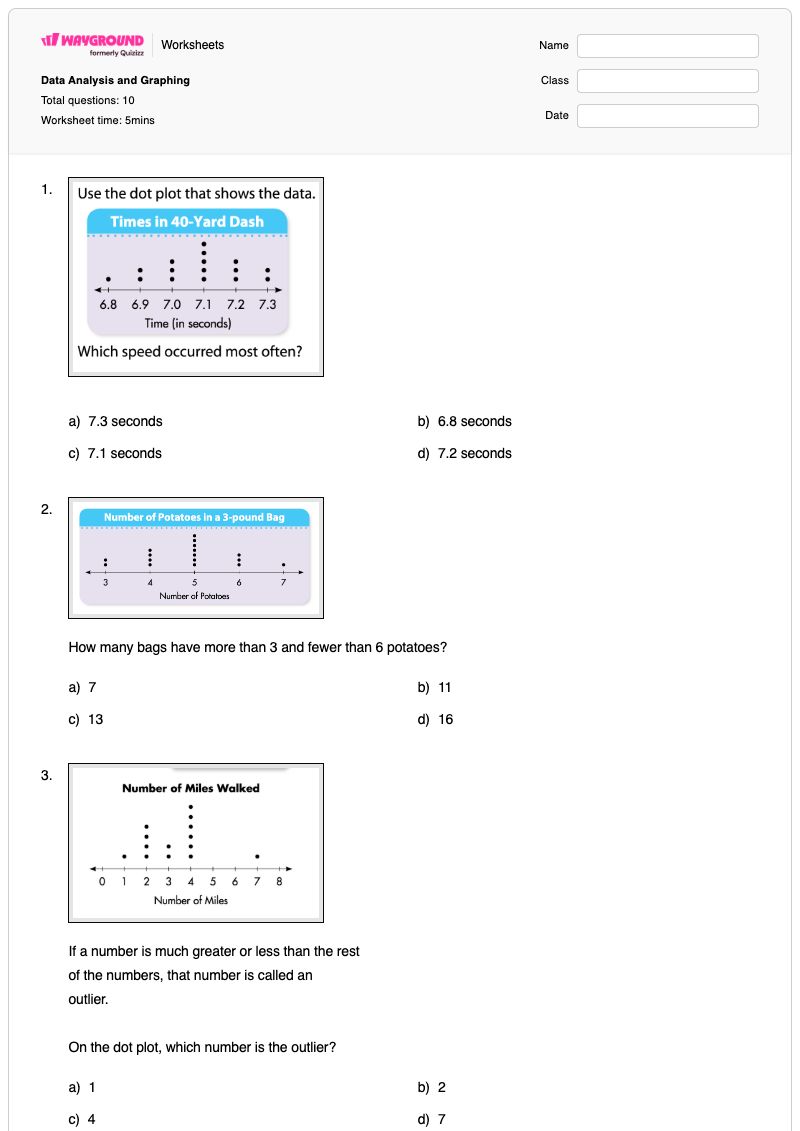
This free printable Grade 5 mathematics worksheet helps students interpret data displayed in dot plots and bar graphs. Through 10 multiple-choice questions, students identify an outlier and the most common value, read a graph’s scale, determine intervals between tick marks, find the greatest response, and compare quantities shown in data displays. The worksheet also asks students to use graph information to solve practical comparison questions, including estimating differences between parks’ rides and comparing weights. It is useful for guided practice, independent review, or a quick check of data-analysis skills. A complete answer key is included, and the worksheet is available as a printable PDF for classroom use.
Worksheet settings
Font size
WorksheetsAnswer Key7.1 seconds
11
7
1
0-80
10
40
12
2
400lbs
This Grade 5 worksheet uses 10 multiple-choice questions to build graph-reading skills with dot plots and bar graphs. Students identify outliers and the most common value, read scales and intervals, find the greatest response, and compare quantities shown in data displays.
First model how to read the numbered scale on a graph, then show that an interval is the difference between neighboring tick marks. Have students explain how the scale and interval support answers about bar heights and comparisons before completing the multiple-choice items independently.
Students may confuse the graph’s full scale with its interval, or count tick marks instead of finding the difference between adjacent values. They may also select the largest visible number instead of identifying the most common value, greatest response, or outlier requested by a particular dot-plot or bar-graph question.
Wayground provides this worksheet as a printable PDF and as a digital quiz, and it includes a complete answer key for the 10 multiple-choice questions. Printable submissions can be graded by scanning student work with the Wayground for Teachers app.
For the dot-plot and bar-graph questions, use Advanced Settings to adjust font spacing or choose a larger font size so graph-reading prompts are easier to follow. You can also enable a dyslexia-friendly font or translate the worksheet into another language when those options better support access to the data-analysis tasks.
Wayground offers a comprehensive collection of free printable worksheets and practice problems across all subjects, with downloadable PDFs and answer keys to support essential skills and concepts. Browse more resources at https://wayground.com/en-us/worksheets.