
Tópicos recomendados para você
- Analyzing Graphs
- Cartesian Graphs
- Characteristics of Graphs
- Circle Graphs
- Color Sorting
- Combining Data
- Coordinate Graphing
- Coordinate Pairs
- Coordinate Plane
- Coordinate Points on a Plane
- Data Clusters
- Data Comparison
- Data Representation
- Data Tables
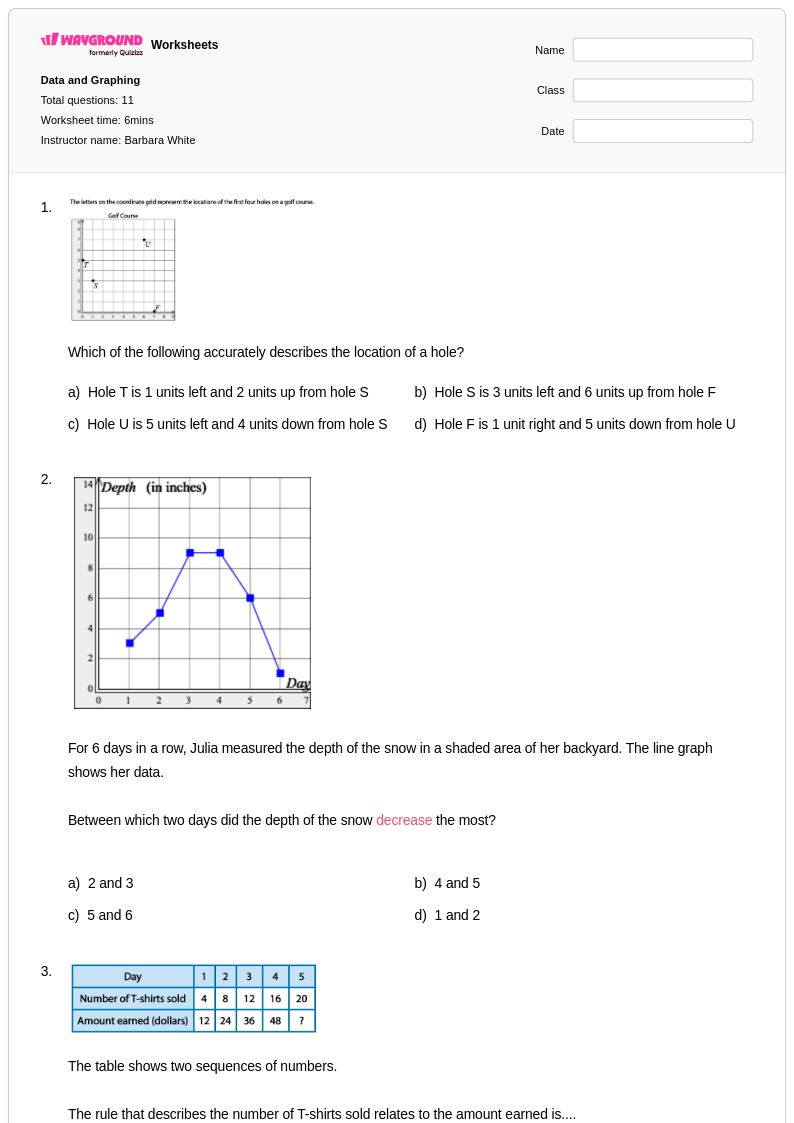
- Distance and Time Graphs
- Dot Plot
- Frequency Charts
- Graph Analysis
- Graph Features
- Graph Theory
- Graphical Analysis
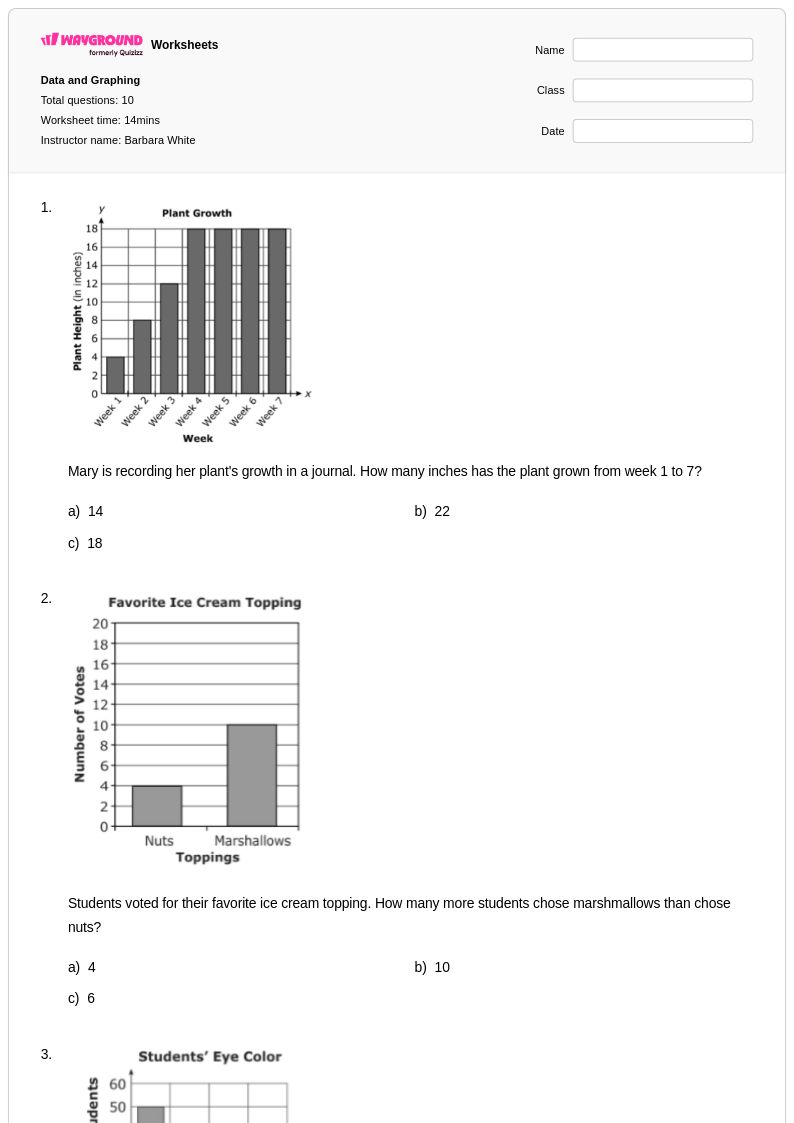
- Graphing Data
- Graphing Exchange Rates
- Graphing from a Table
- Graphing Ordered Pairs
- Graphing Patterns
- Graphing Points
- Graphing Real World Applications
- Graphing with Tables
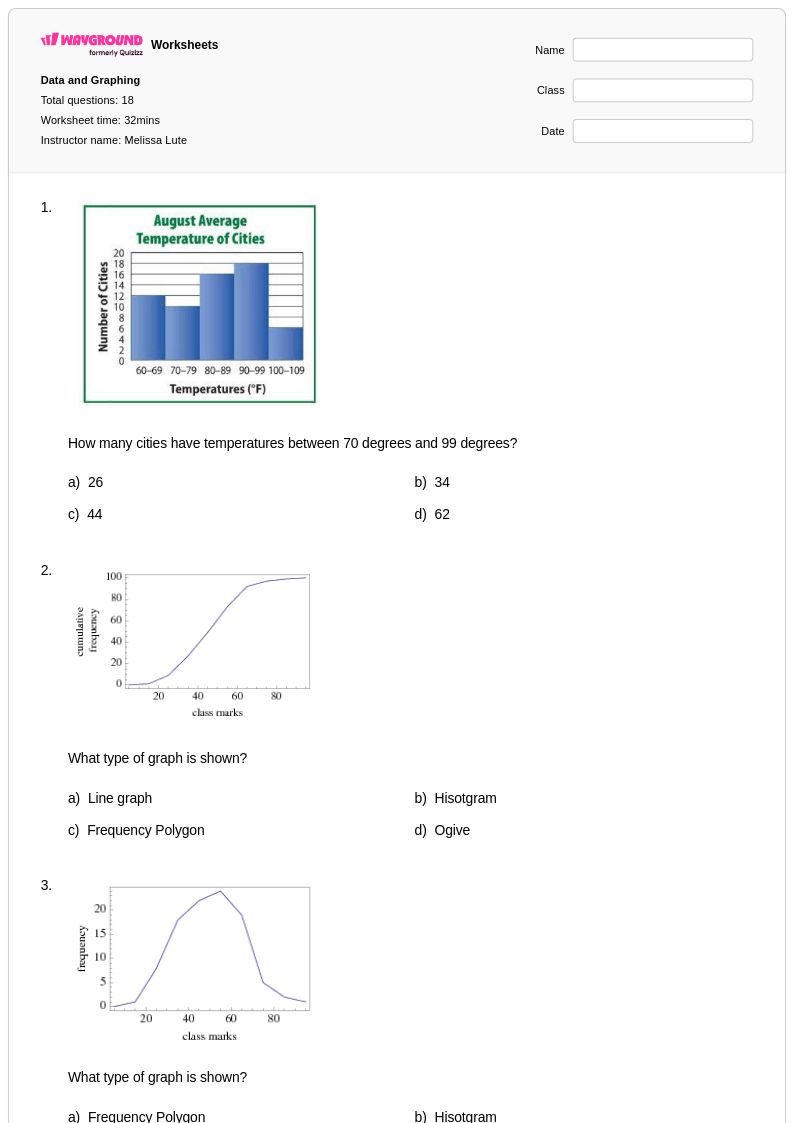
- Histogram Interpretation
- Interpreting Linear Graphs
- Key Features of Graphs
- Merging Data
- Misleading Graphs
- Organizing Data
- Pie Charts
- Pie Graphs
- Pivot Tables in Data Analysis
- Plotting Points on the Coordinate Plane
- Predicting in Data Analysis
- Probability of Compound Events
- Quadrants on the Coordinate Plane
- Qualitative Data
- Qualitative Graphs
- Qualitative Vs Quantitative Data
- Quantitative Data Analysis
- Reading Charts
- Reading Graphs
- Reading Tables
- Scatter Plot Association
- Scatter Plot Correlation
- Scatter Plot Word Problems
- Sorting by Size
- Spreadsheet Cell References
- Statistics
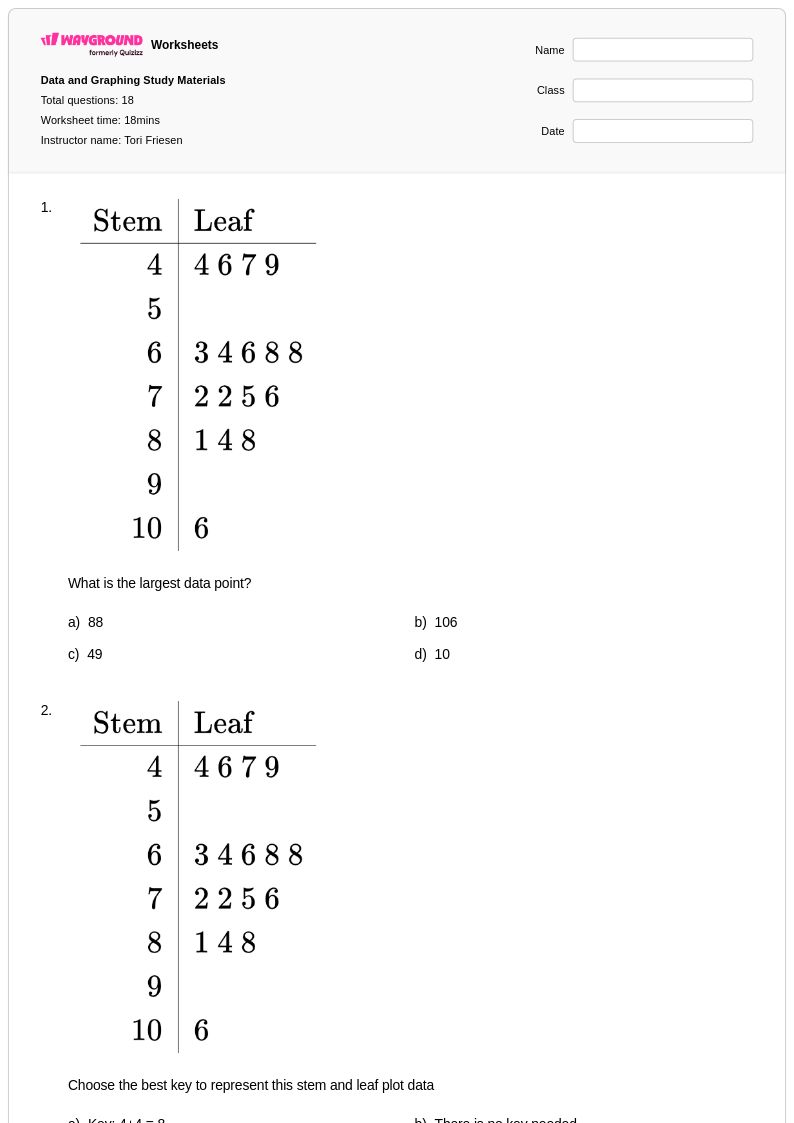
- Stem and Leaf Plot
- Step Graphs
- Tally Graphs
- Tally Marks
- Tape Diagrams
- Types of Graphs
- Velocity-time Graphs
- Venn Diagrams
- X and Y Axes
14Q
3rd
10Q
4th
15Q
5th - Uni
7Q
2nd
10Q
3rd
14Q
3rd
15Q
3rd - Uni
15Q
5th
20Q
6th - Uni
20Q
4th - Uni
14Q
2nd
9Q
6th - Uni
10Q
5th
15Q
4th - Uni
20Q
6th - 8th
10Q
2nd
25Q
2nd
20Q
4th
10Q
1st
10Q
3rd - Uni
18Q
6th
10Q
3rd
18Q
9th - 12th
11Q
5th
Explore planilhas por série
Explore planilhas Data and Graphing por tópicos
- Analyzing Graphs
- Cartesian Graphs
- Characteristics of Graphs
- Circle Graphs
- Color Sorting
- Combining Data
- Coordinate Graphing
- Coordinate Pairs
- Coordinate Plane
- Coordinate Points on a Plane
- Data Clusters
- Data Comparison
- Data Representation
- Data Tables
- Distance and Time Graphs
- Dot Plot
- Frequency Charts
- Graph Analysis
- Graph Features
- Graph Theory
Explore planilhas por assuntos
Explore printable Data and Graphing worksheets
Data and graphing worksheets available through Wayground (formerly Quizizz) provide comprehensive practice opportunities for students to develop essential statistical literacy and visual interpretation skills. These educational resources encompass a wide range of activities including reading and creating bar graphs, line graphs, pie charts, and scatter plots, while also covering data collection, organization, and analysis techniques. The worksheets strengthen critical mathematical competencies such as identifying patterns and trends in datasets, calculating measures of central tendency, interpreting statistical displays, and drawing evidence-based conclusions from graphical representations. Each printable resource includes detailed answer keys and step-by-step solutions, making them valuable tools for both independent practice problems and guided instruction, with free pdf formats ensuring easy accessibility for classroom and home use.
Wayground (formerly Quizizz) empowers educators with an extensive collection of millions of teacher-created data and graphing worksheets that streamline instructional planning and differentiated learning experiences. The platform's robust search and filtering capabilities allow teachers to quickly locate age-appropriate materials aligned with curriculum standards, while built-in customization tools enable modification of practice problems to match diverse student needs and skill levels. These versatile resources are available in both printable pdf formats for traditional pencil-and-paper work and digital formats for interactive online practice, supporting flexible implementation across various learning environments. Teachers can effectively utilize these worksheets for targeted remediation of statistical concepts, enrichment activities for advanced learners, and systematic skill practice that builds student confidence in data interpretation and graphical analysis.