
Recommended Topics for you
- Characteristics of Graphs
- Circle Graphs
- Color Sorting
- Combining Data
- Data Comparison
- Data Representation
- Data Tables
- Dot Plot
- Frequency Charts
- Graph Features
- Graphing Data
- Graphing from a Table
- Graphing Patterns
- Graphing with Tables
- Key Features of Graphs
- Merging Data
- Organizing Data
- Pie Charts
- Pie Graphs
- Predicting in Data Analysis
- Qualitative Data
- Qualitative Graphs
- Qualitative Vs Quantitative Data
- Reading Charts
- Reading Graphs
- Reading Tables
- Sorting by Size
- Statistics
- Tally Graphs
- Tally Marks
- Tape Diagrams
- Types of Graphs
- Venn Diagrams
- X and Y Axes
14 Q
3rd
10 Q
3rd
14 Q
3rd
15 Q
3rd - Uni
10 Q
3rd - Uni
10 Q
3rd

20 Q
3rd - Uni
10 Q
3rd
20 Q
2nd - 3rd
12 Q
2nd - 4th
11 Q
3rd - Uni
14 Q
3rd
10 Q
3rd - 4th
17 Q
3rd - Uni
24 Q
1st - 5th
20 Q
3rd
12 Q
3rd
22 Q
2nd - 4th
14 Q
3rd
8 Q
3rd
18 Q
2nd - 4th
11 Q
3rd
7 Q
3rd
16 Q
3rd
Explore Data and Graphing Worksheets by Grades
Explore Data and Graphing Worksheets for year 3 by Topic
- Characteristics of Graphs
- Circle Graphs
- Color Sorting
- Combining Data
- Data Comparison
- Data Representation
- Data Tables
- Dot Plot
- Frequency Charts
- Graph Features
- Graphing Data
- Graphing from a Table
- Graphing Patterns
- Graphing with Tables
- Key Features of Graphs
- Merging Data
- Organizing Data
- Pie Charts
- Pie Graphs
- Predicting in Data Analysis
Explore Other Subject Worksheets for year 3
Explore printable Data and Graphing worksheets for Year 3
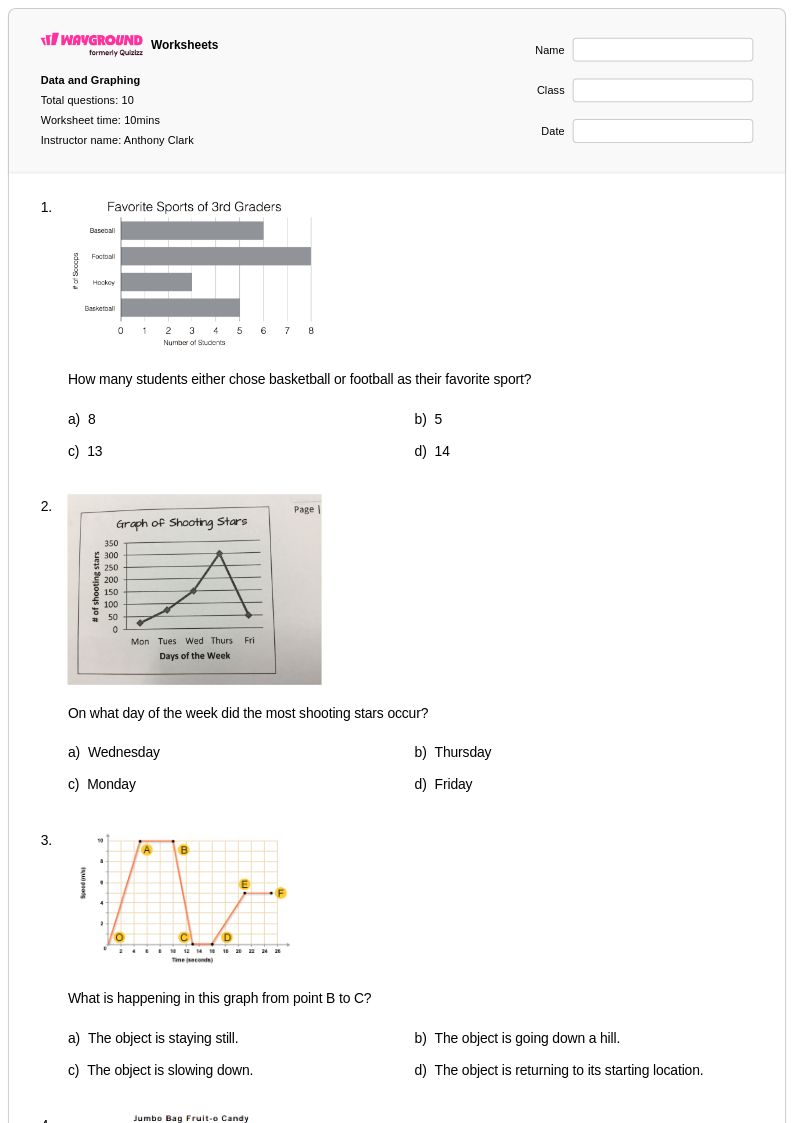
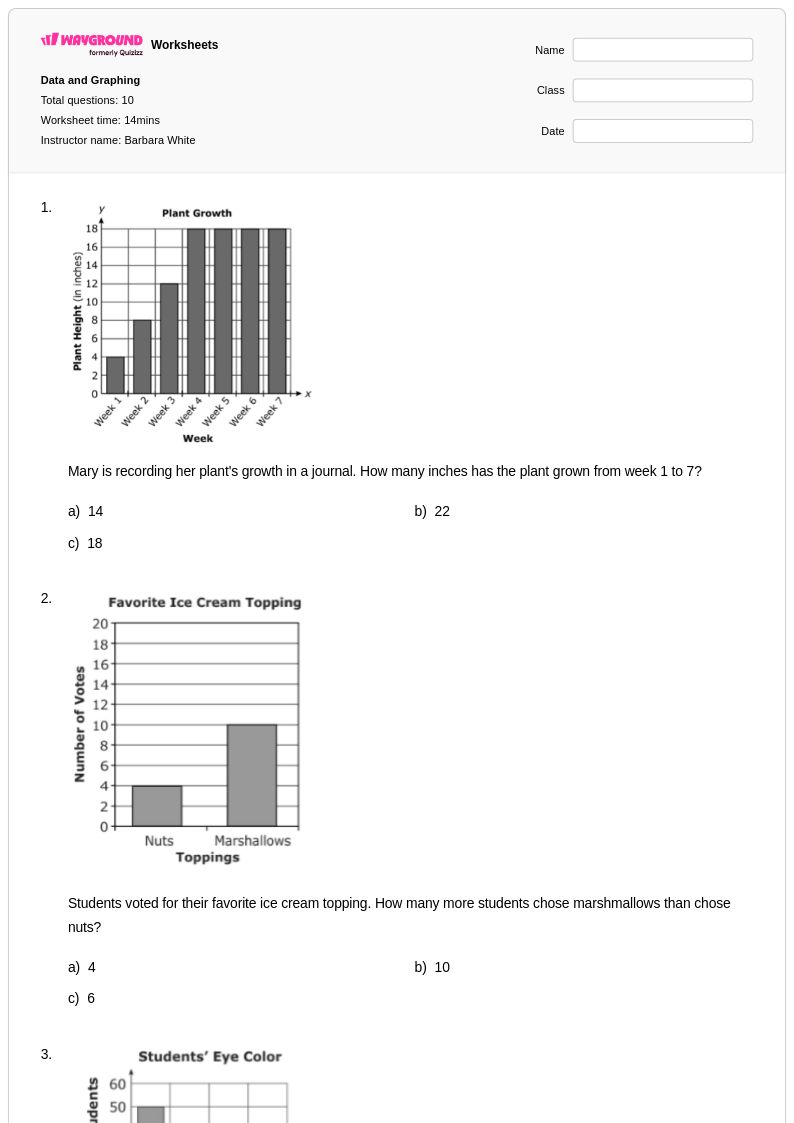
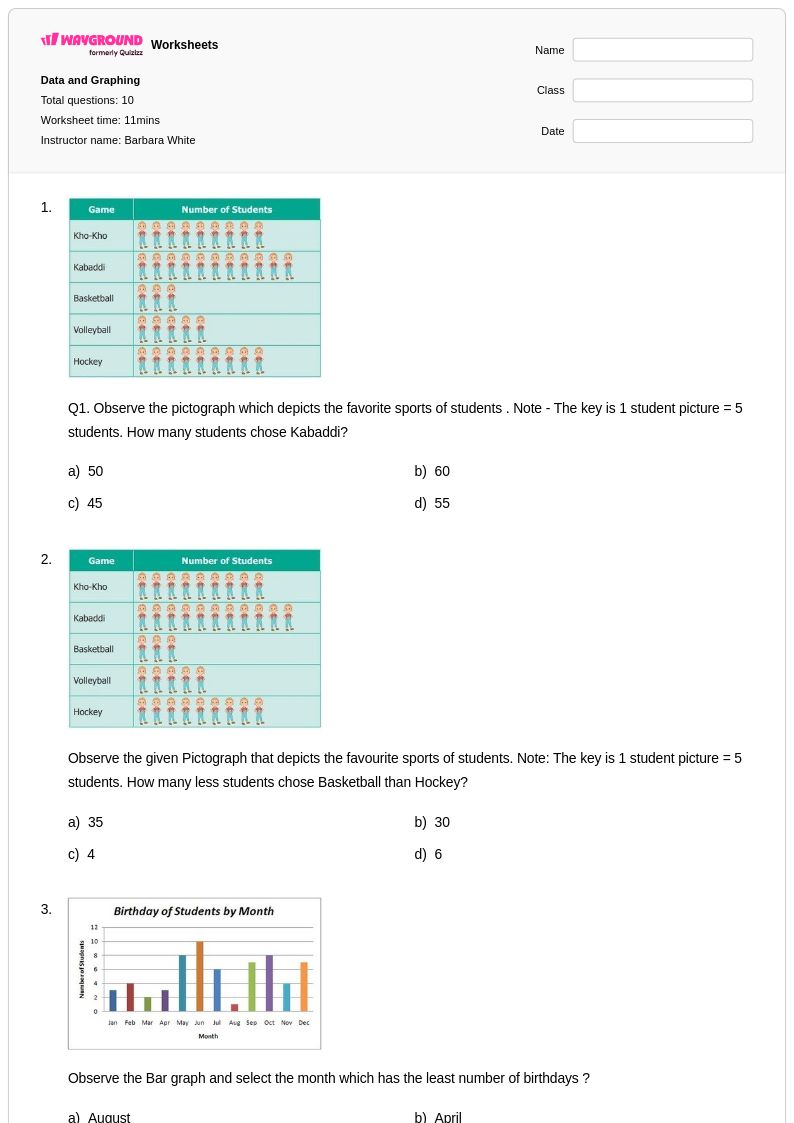
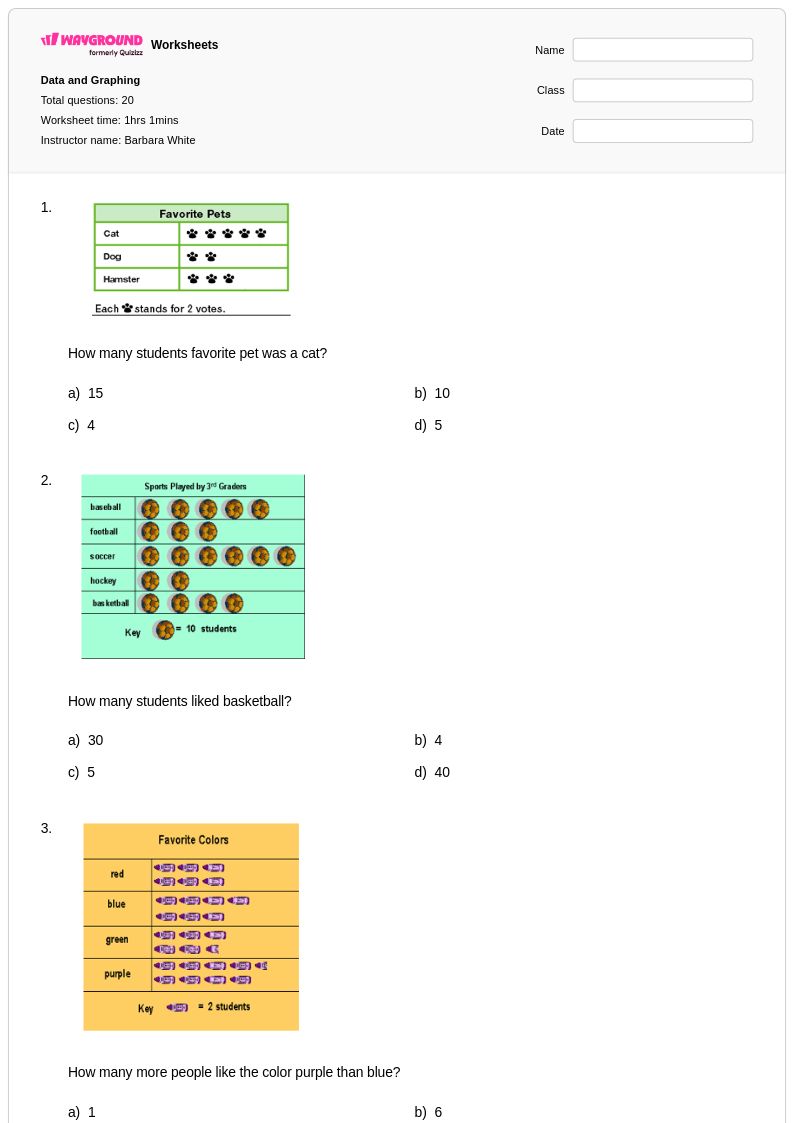
Data and graphing worksheets for Year 3 students available through Wayground (formerly Quizizz) provide essential practice in collecting, organizing, and interpreting information through visual representations. These comprehensive worksheets strengthen foundational statistical literacy skills by engaging students with picture graphs, bar graphs, tally charts, and data collection activities that align with third-grade mathematical standards. Students develop critical thinking abilities as they analyze data sets, draw conclusions from graphical information, and create their own visual displays of numerical information. The collection includes free printables with complete answer keys, allowing educators to implement immediate assessment and provide targeted feedback on student understanding of data interpretation concepts and graphing techniques.
Wayground (formerly Quizizz) supports mathematics educators with an extensive library of millions of teacher-created data and graphing resources specifically designed for Year 3 instruction. The platform's robust search and filtering capabilities enable teachers to locate worksheets that precisely match their curriculum needs, whether focusing on specific graph types, data collection methods, or complexity levels appropriate for individual student abilities. Standards-aligned content ensures that practice problems directly support required learning objectives, while differentiation tools allow educators to customize worksheets for remediation or enrichment purposes. Teachers can access these resources in both printable PDF formats for traditional classroom use and digital formats for technology-integrated instruction, streamlining lesson planning and providing flexible options for skill practice, formative assessment, and individualized student support.