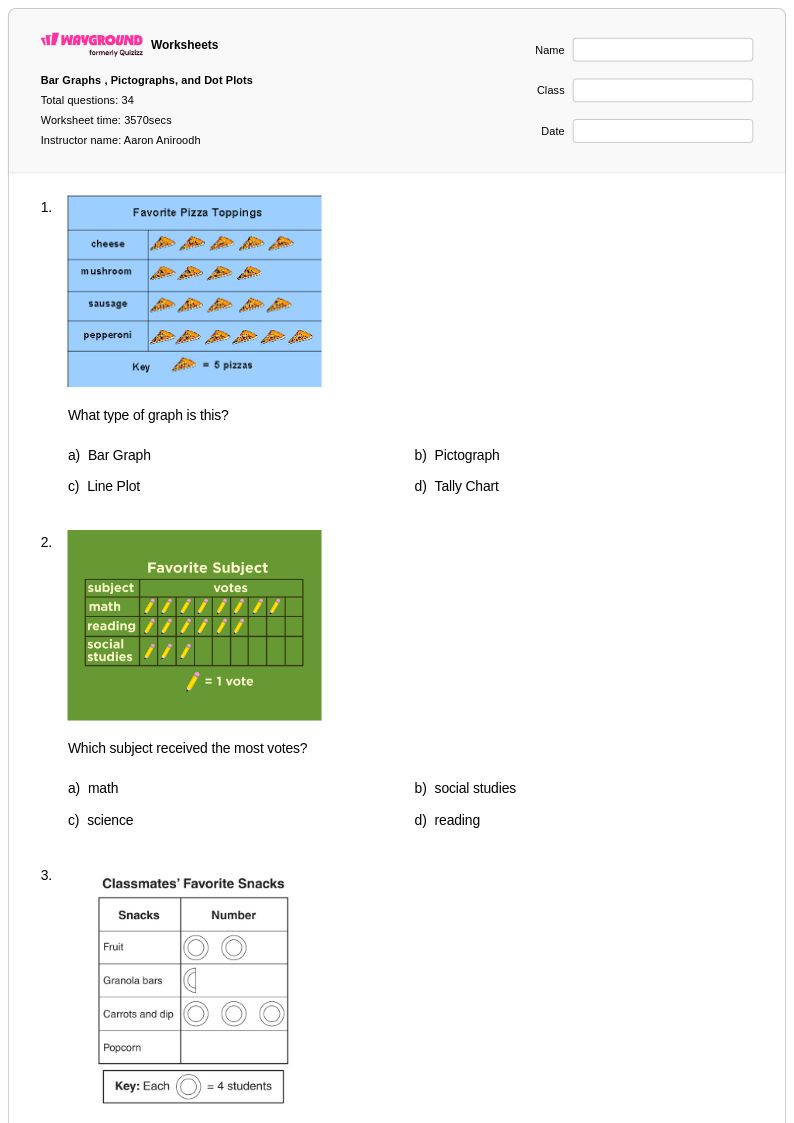
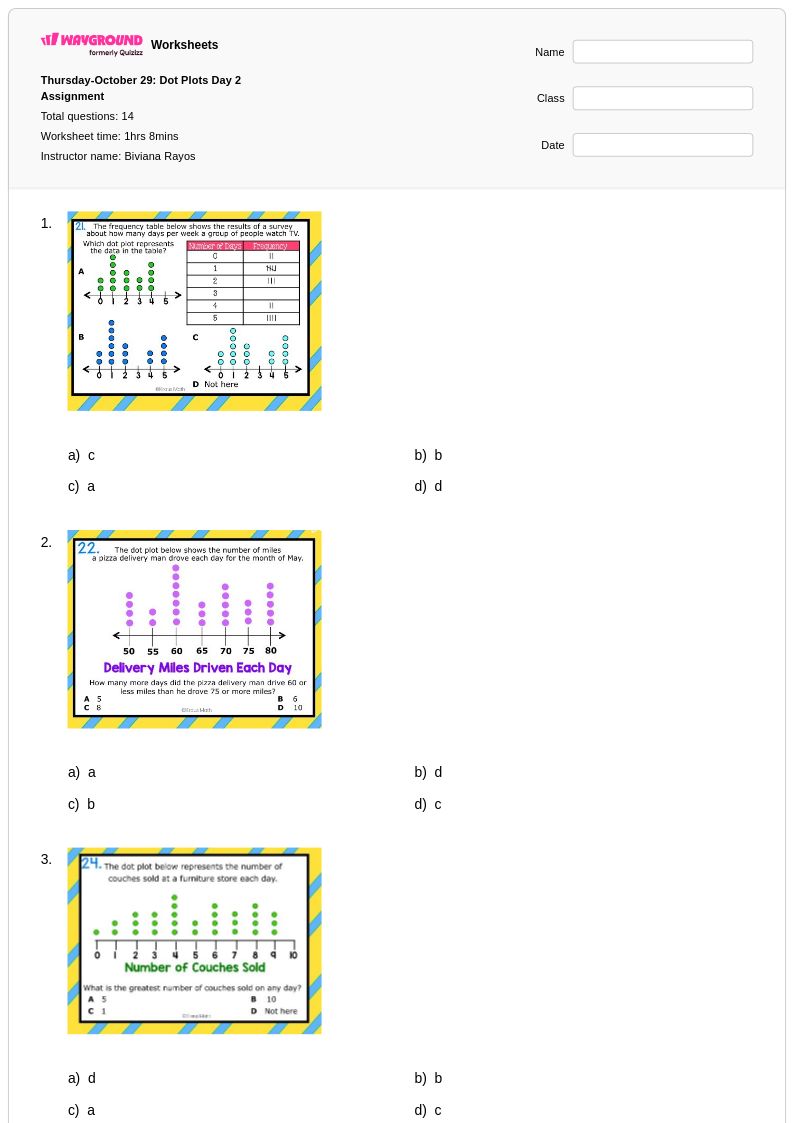
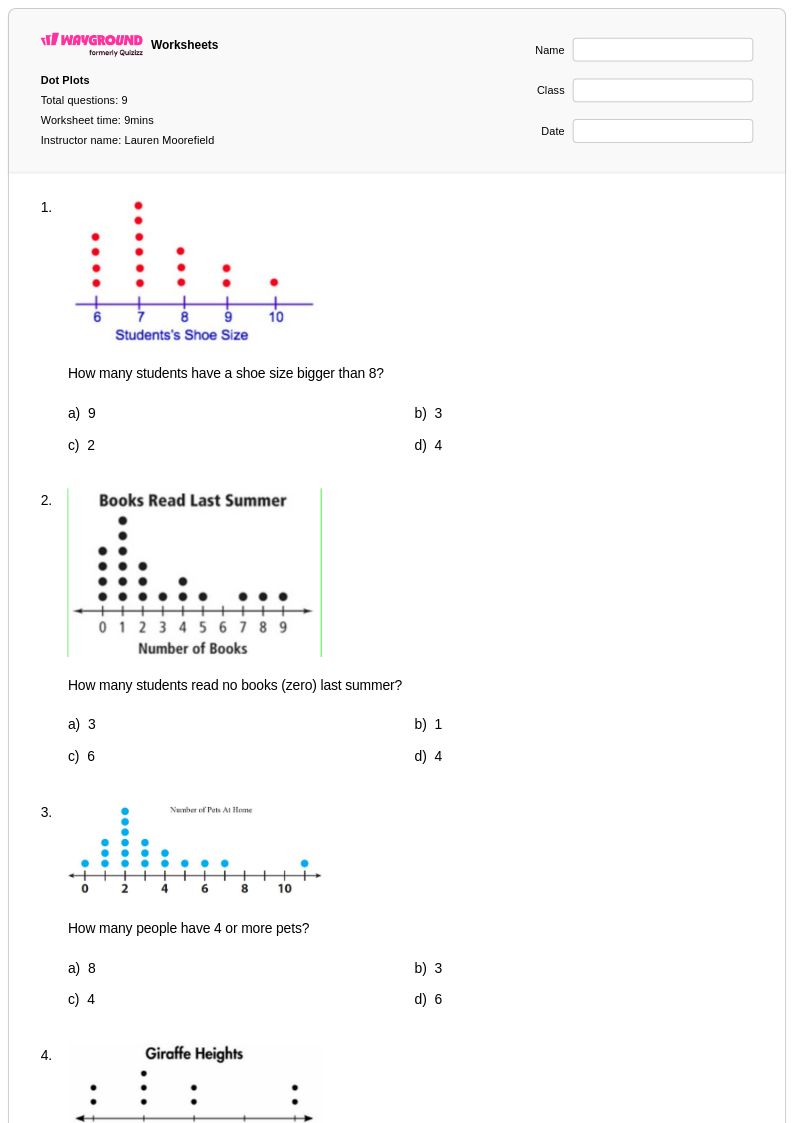
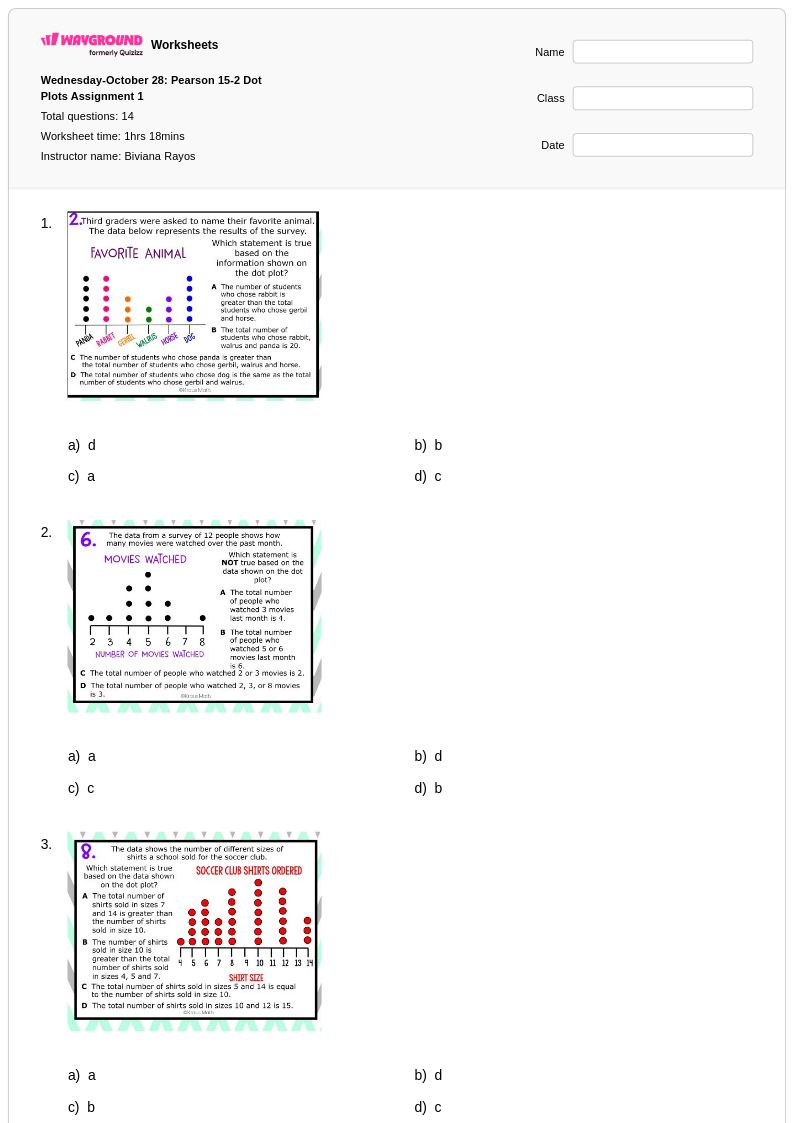
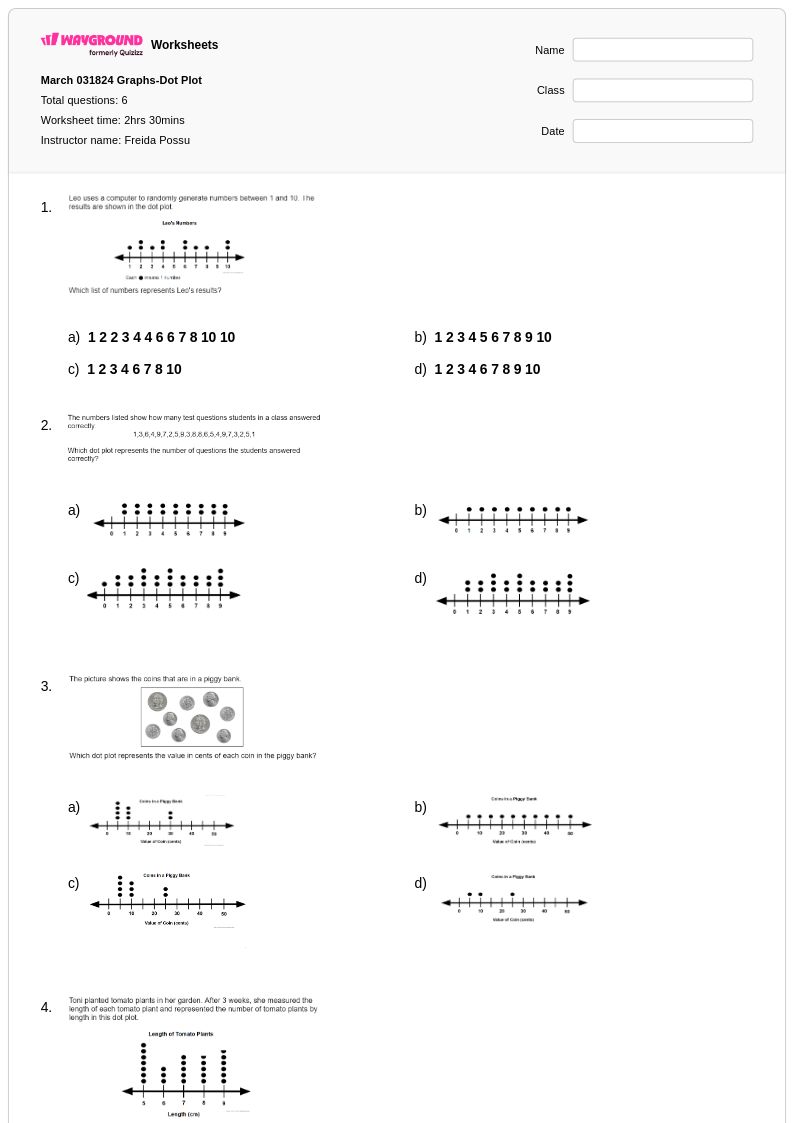
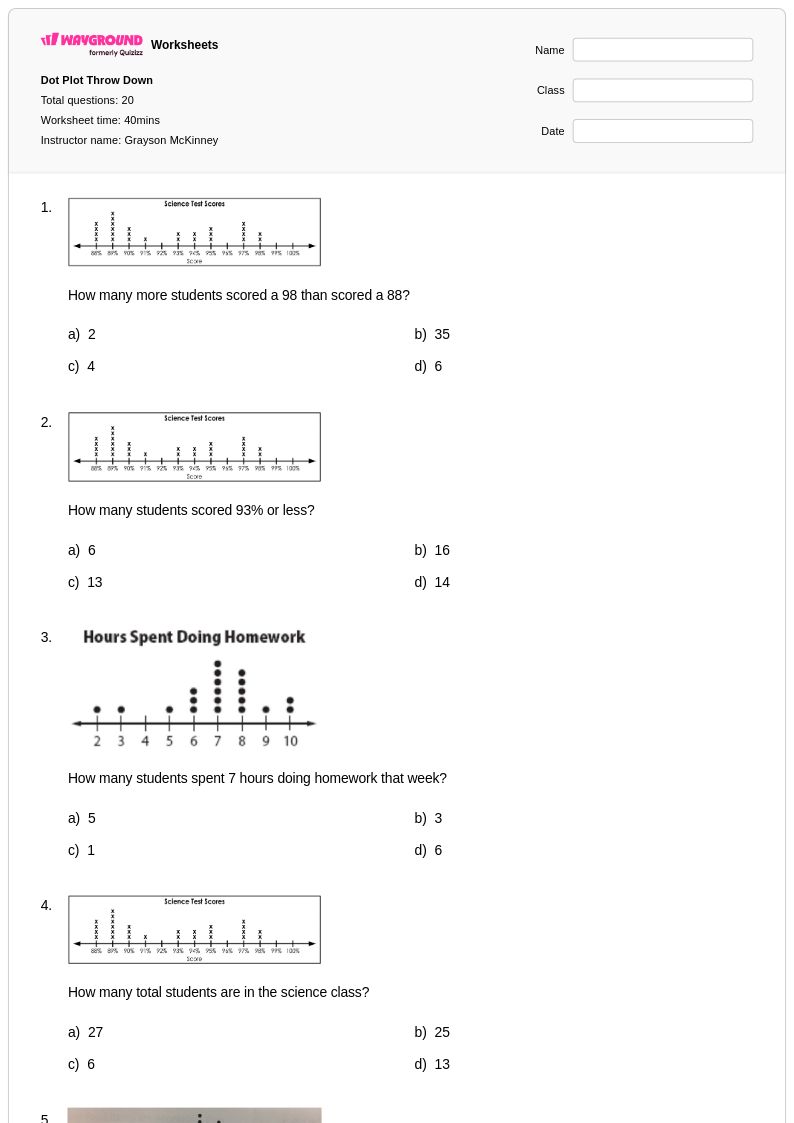
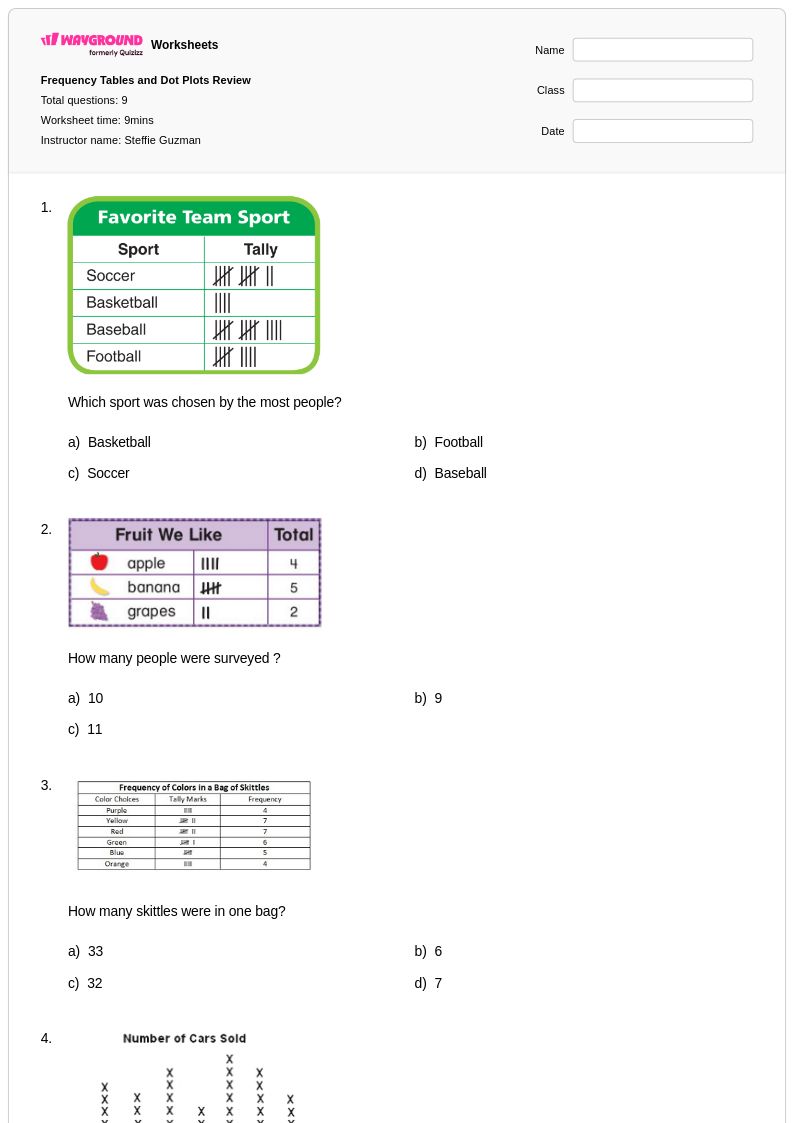
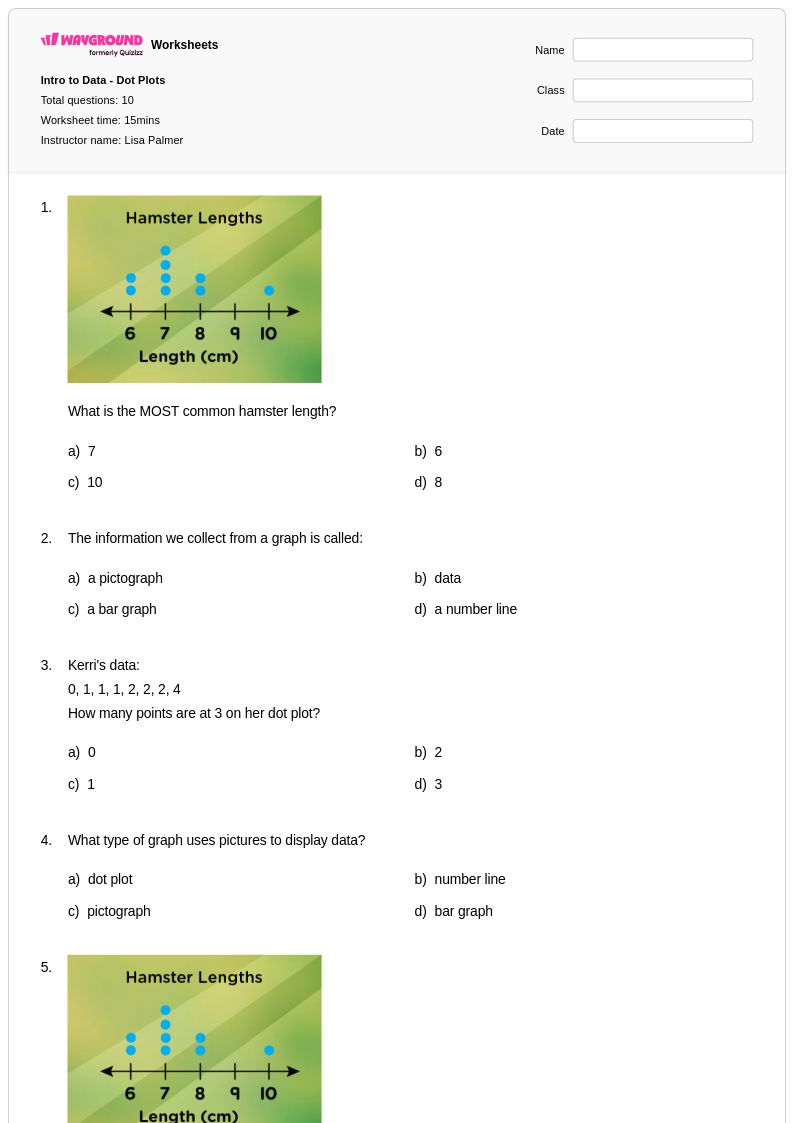
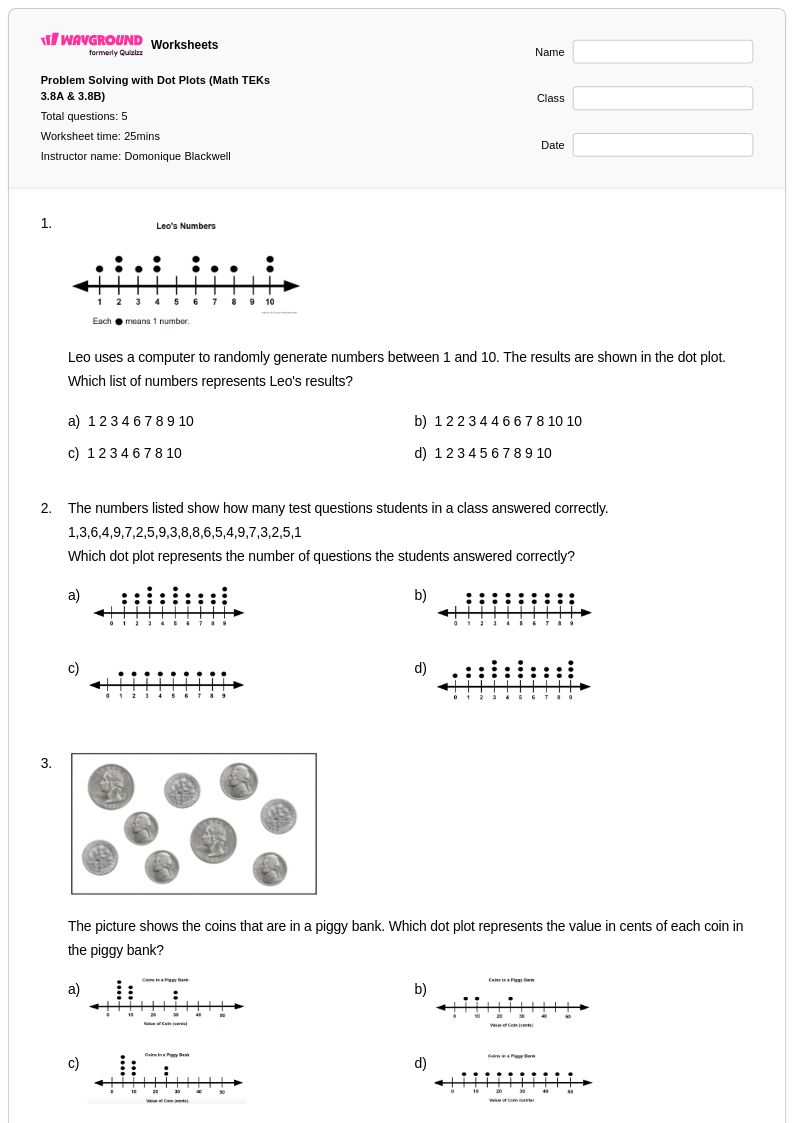
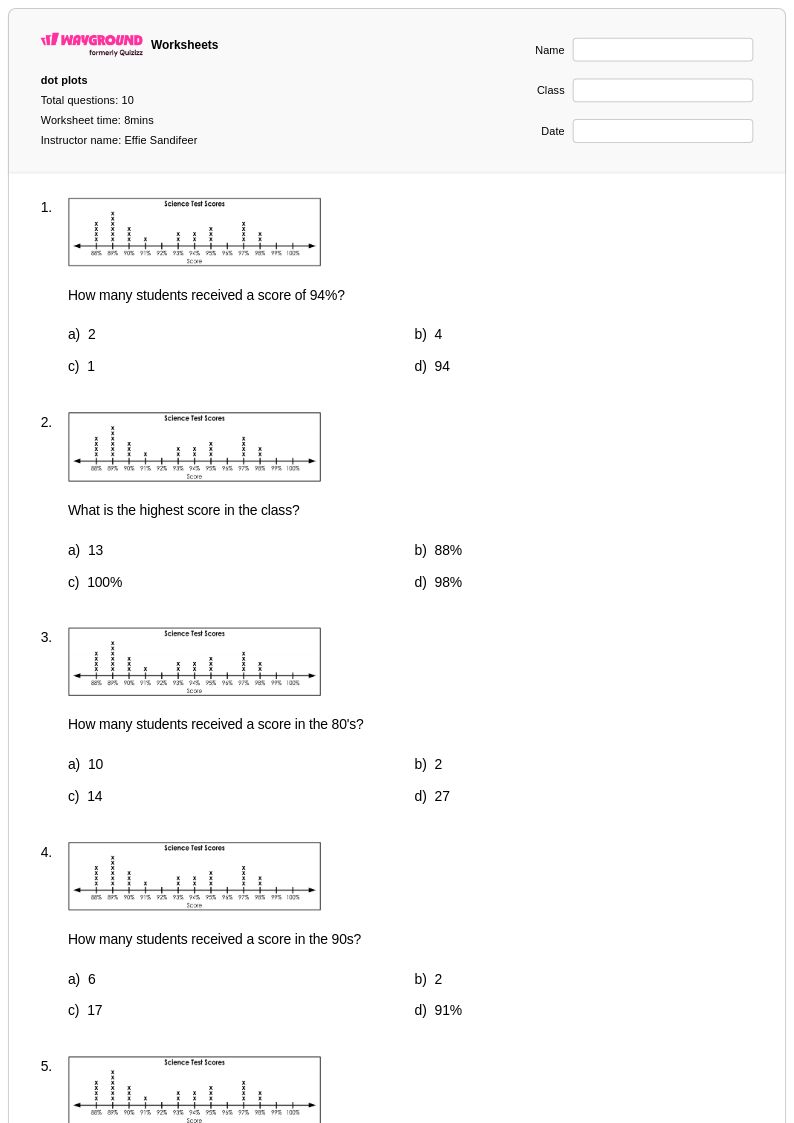
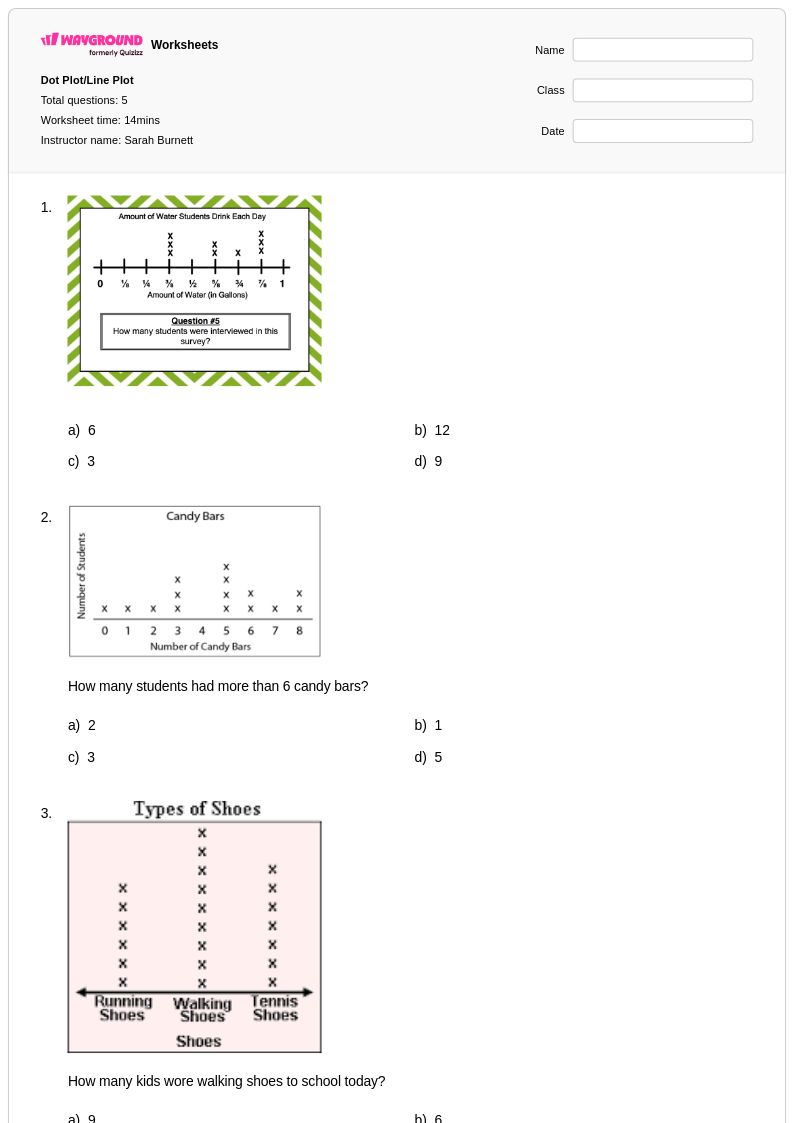
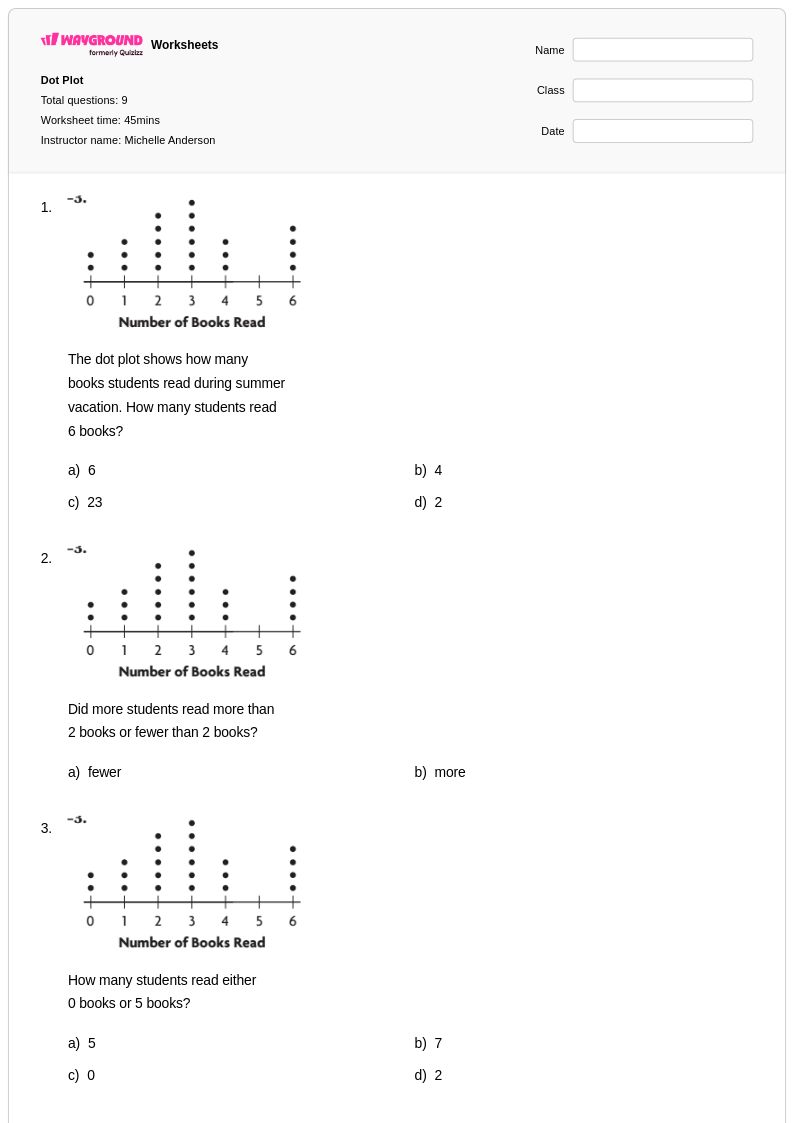
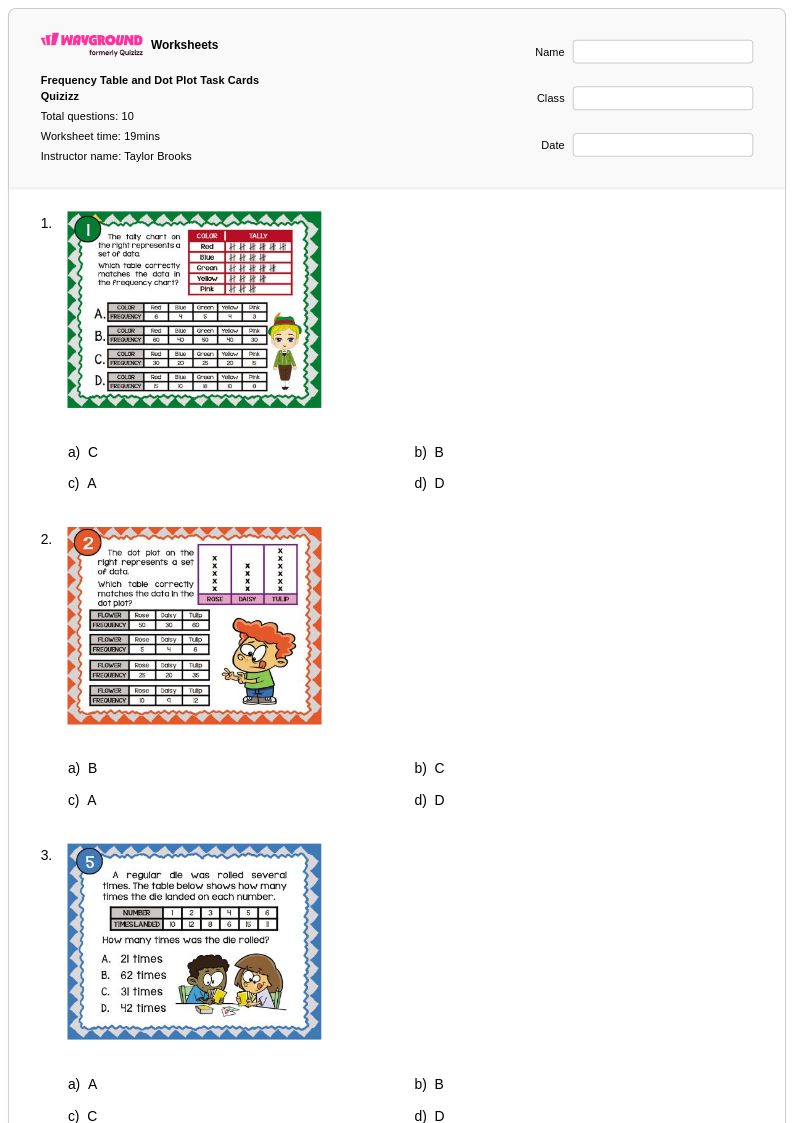
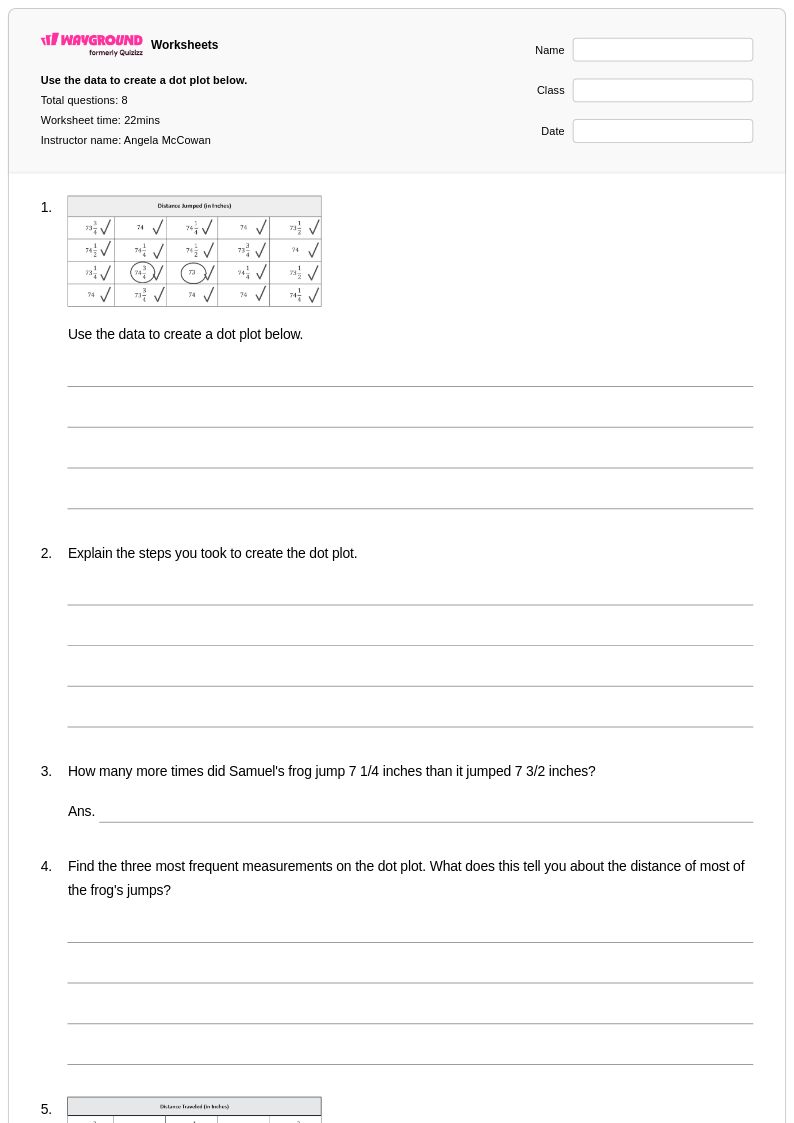
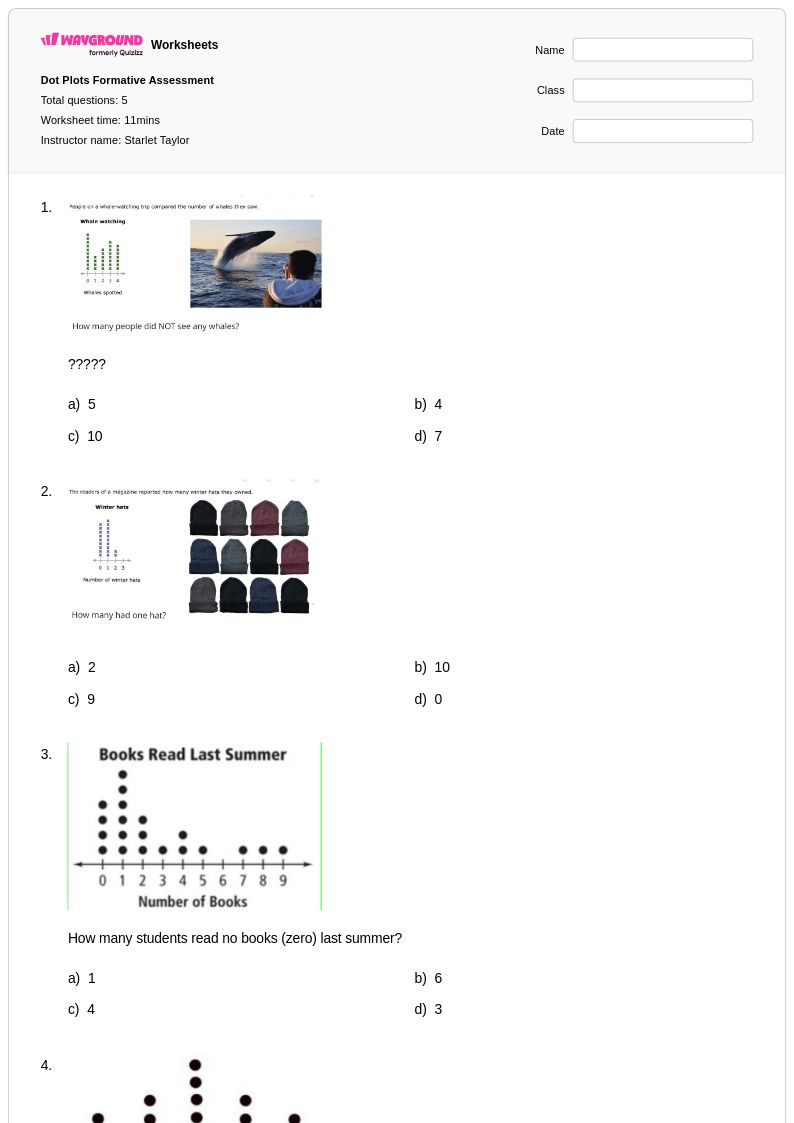
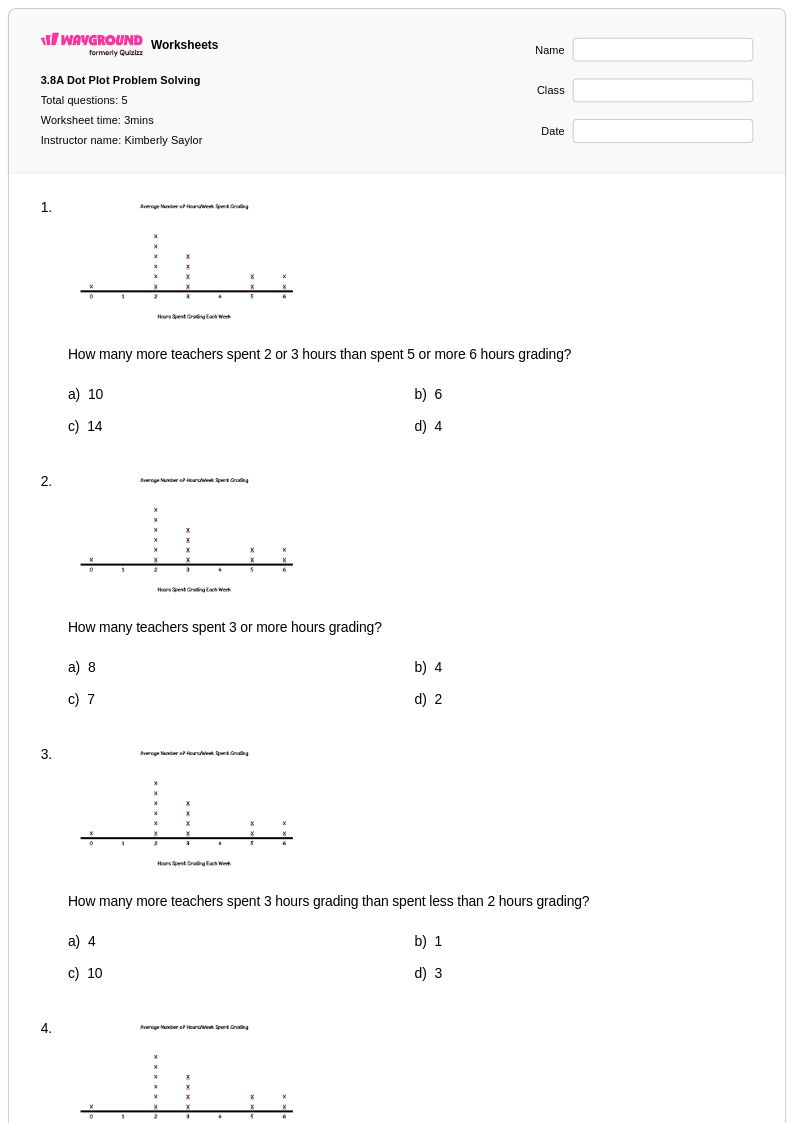
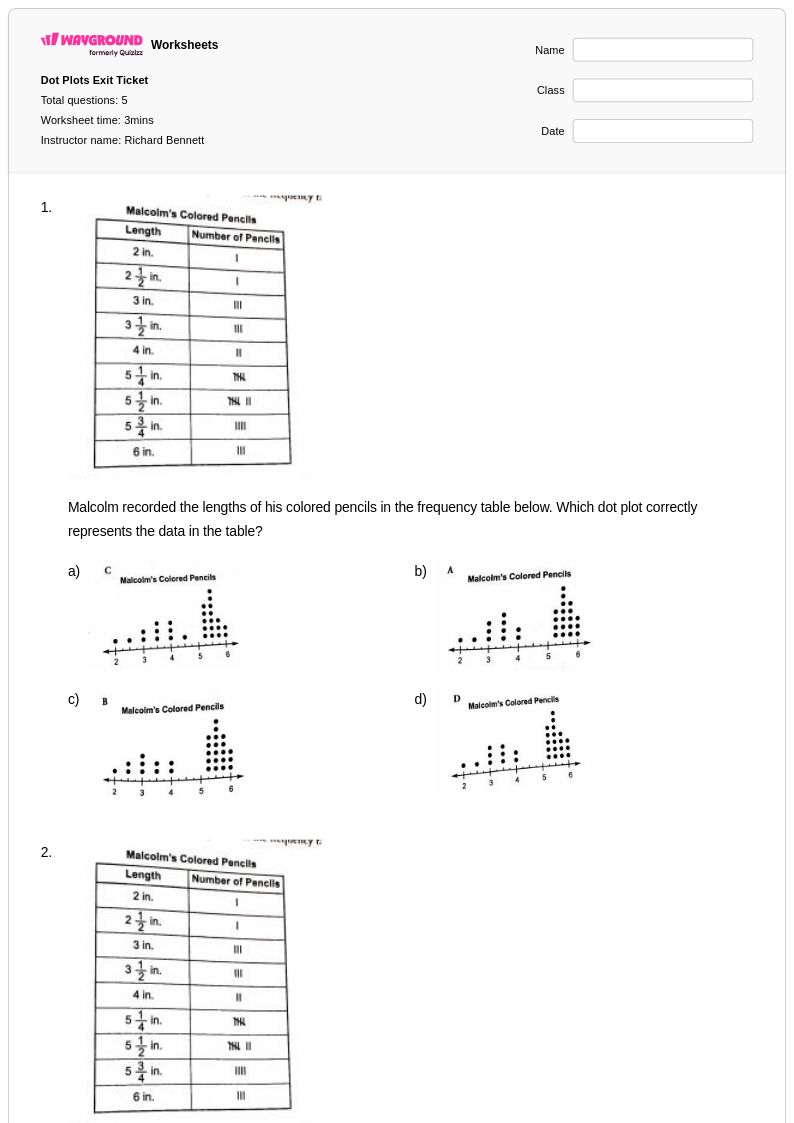
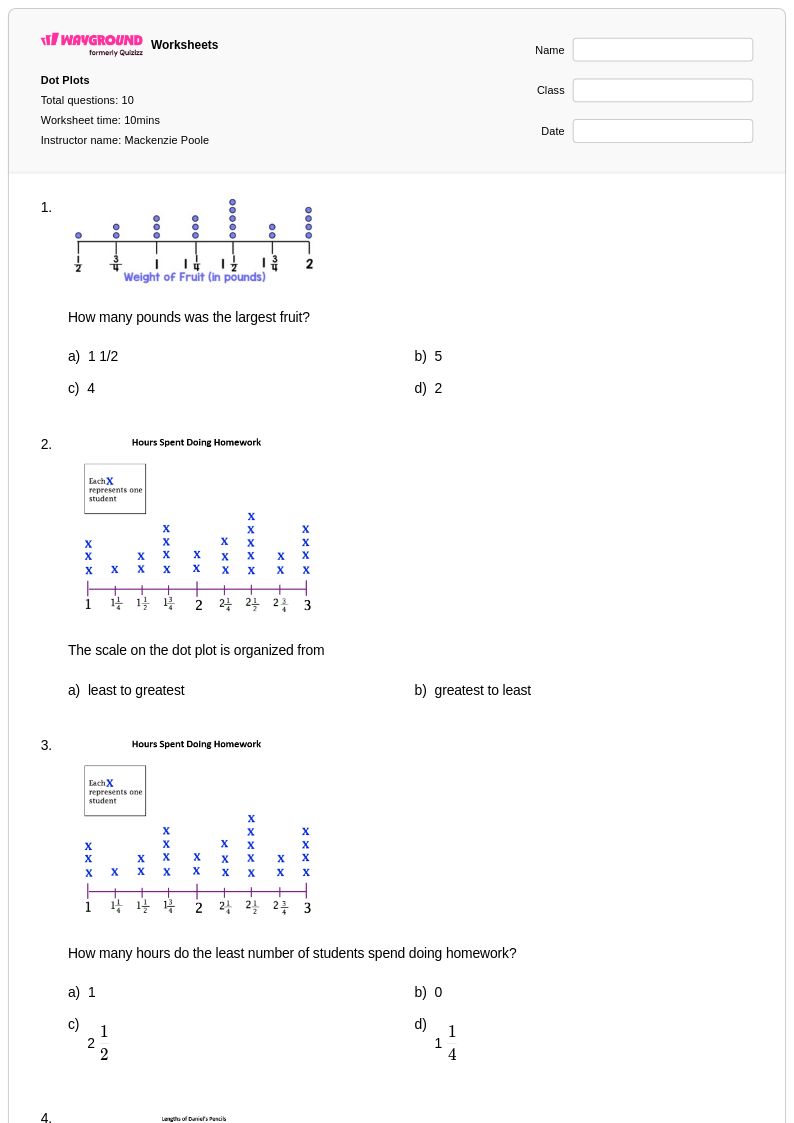
Wayground's Year 3 dot plot worksheets provide free printables with practice problems and answer keys to help students master data visualization and graphing skills through engaging exercises.
Year 3 dot plot worksheets available through Wayground (formerly Quizizz) provide essential practice for young learners developing foundational data representation skills. These comprehensive printables focus on teaching students how to create, read, and interpret dot plots using age-appropriate data sets such as favorite colors, pet preferences, or classroom survey results. The worksheets systematically build understanding of how dots represent individual data points, how to organize information along a number line, and how to draw conclusions from visual data displays. Each free resource includes practice problems that progress from simple dot plot reading exercises to more complex tasks requiring students to construct their own plots, complete with answer keys that support independent learning and immediate feedback for both students and educators.
Wayground's extensive collection of Year 3 dot plot materials draws from millions of teacher-created resources, offering educators unprecedented access to diverse, standards-aligned content that addresses varying skill levels and learning needs. The platform's robust search and filtering capabilities enable teachers to quickly locate worksheets that match specific curriculum requirements, whether for initial instruction, remediation, or enrichment activities. These customizable resources are available in both printable PDF format and interactive digital versions, allowing for seamless integration into traditional classroom settings or remote learning environments. Teachers can easily differentiate instruction by selecting from worksheets with varying complexity levels, modify existing content to meet individual student needs, and utilize the comprehensive answer keys to streamline grading and identify areas requiring additional skill practice or targeted intervention.
FAQs
How do I teach dot plots to third graders?
Third graders grasp dot plots fastest when the data comes from them. Run a quick class survey — favorite fruit, number of pets — and plot the results together on a number line drawn on the board. Narrate each step out loud: "We have one student who has 2 pets, so I put one dot above the 2." Once students see how each dot represents one person's answer, they're ready to read and build plots on their own.
What dot plot exercises are appropriate for Grade 3 students?
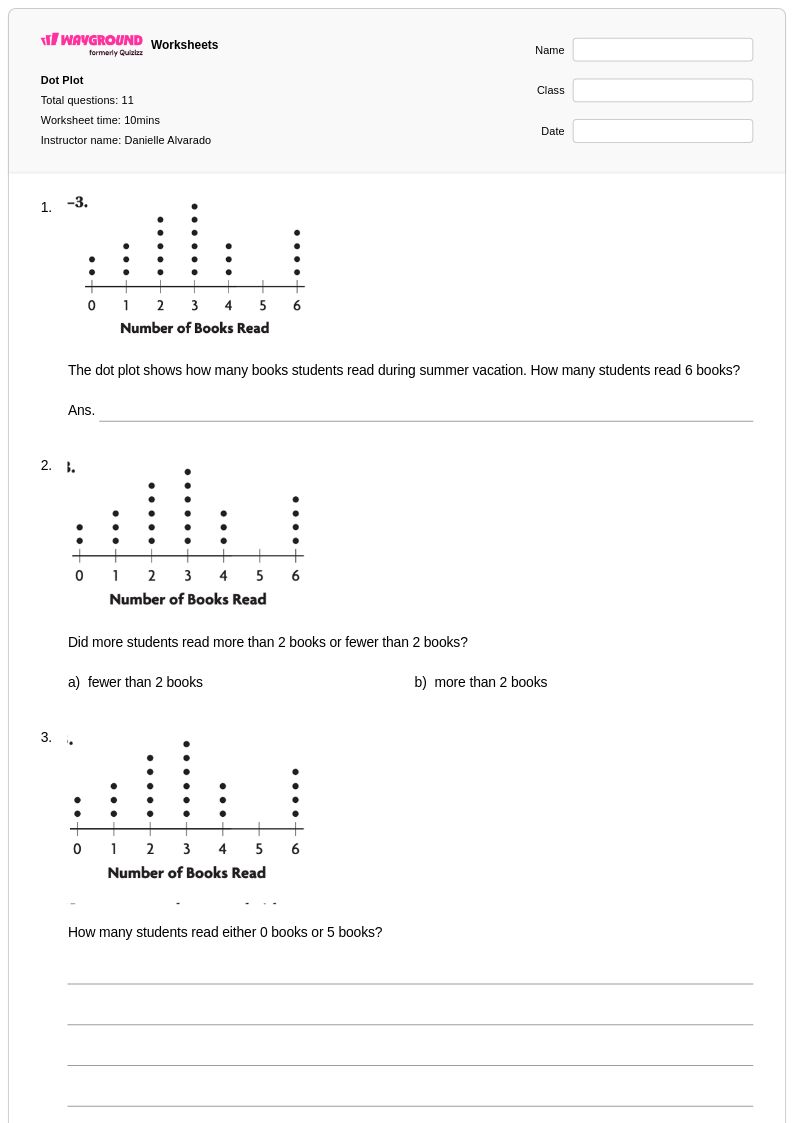
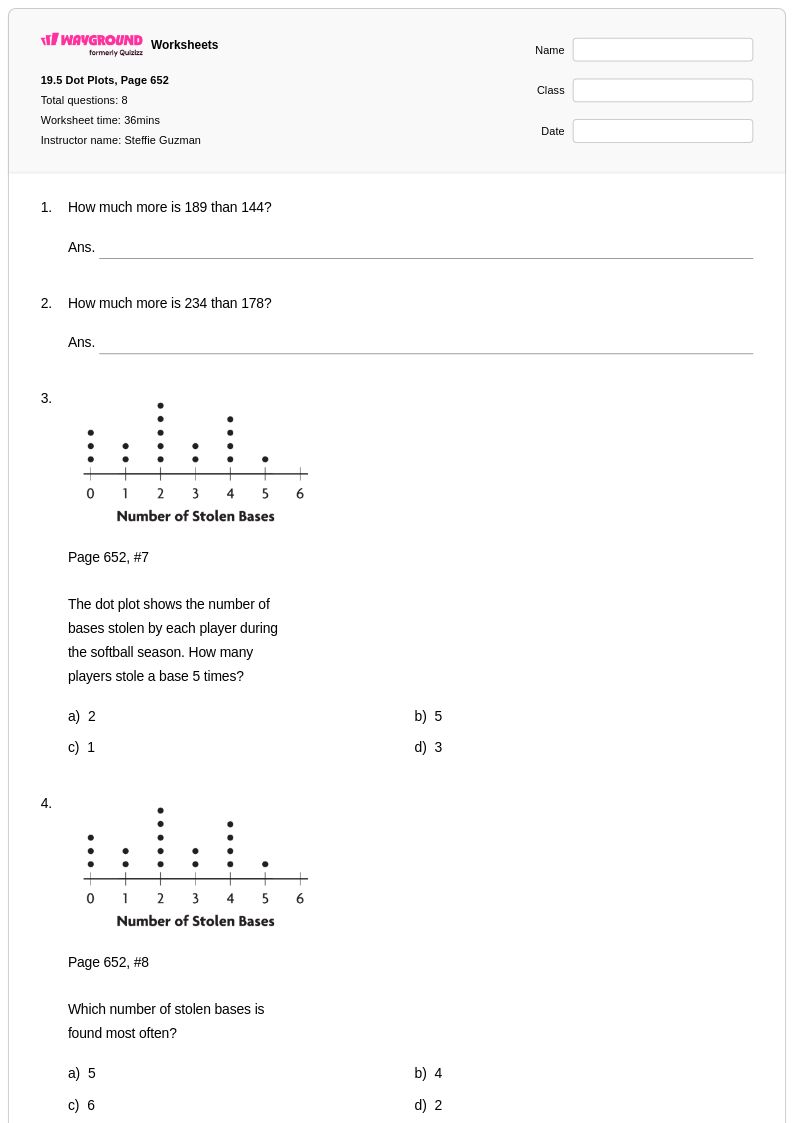
At this level, practice should focus on three things: placing dots correctly above a number line, counting dots to answer simple frequency questions ("how many students chose red?"), and making basic comparisons ("which value has the most dots?"). Wayground's Grade 3 dot plot worksheets use age-appropriate datasets — favorite colors, pet counts, classroom survey results — so the context stays familiar while the skill builds.
What mistakes do third graders commonly make with dot plots?
The most common issue is dot placement: students put dots between numbers rather than directly above the correct value on the number line. A close second is miscounting when multiple dots stack on the same value — they skip one or count the same dot twice. It helps to have students number each dot in a stack as they count, at least while the skill is new.
How do I use these Grade 3 dot plot worksheets in my classroom?
Print the PDF and use it as a guided activity, a center task, or independent practice — each worksheet includes a complete answer key so students can self-check or you can review answers as a class. If you prefer a paperless option, host the same worksheet as a digital quiz on Wayground and assign it to your class directly. Printable versions are a good fit for schools managing screen time in the early grades.
What grade level are dot plots introduced in Common Core?
Common Core introduces line plots (the term used for dot plots in elementary math) in Grade 2, where students organize whole-number data on a number line. Grade 3 extends this by working with larger datasets and asking students to draw conclusions from the display — not just build it. This makes third grade the key year for moving from "I can make a dot plot" to "I can read and interpret one."
How can I support diverse learners with Grade 3 dot plot practice?
For students who find dense dot stacks visually confusing, Wayground's worksheet tools let you increase font size and line spacing to open up the layout. For emerging readers who struggle with written question prompts, the Read Aloud accommodation reads questions aloud so the barrier is the math, not the text. Both adjustments apply per student and don't change anything for the rest of the class.