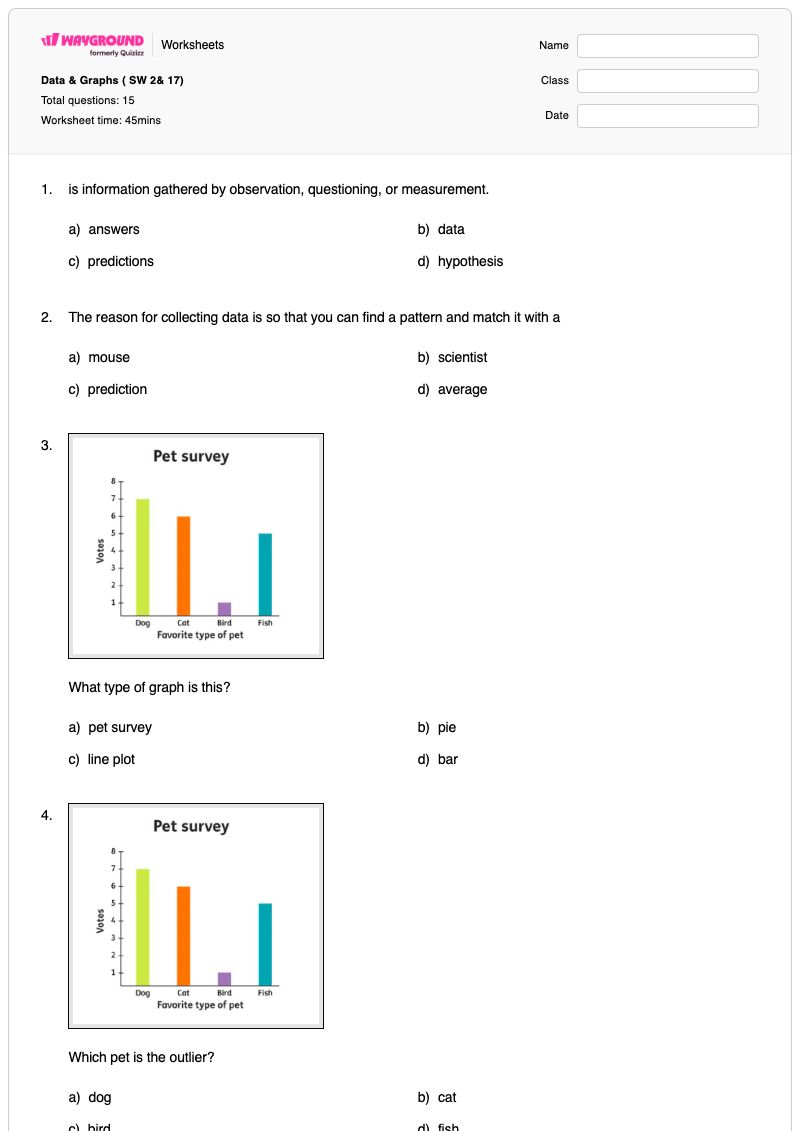
Data & Graphs (SW 2 & 17) is a free printable Grade 4 science worksheet with 15 questions that connect data collection, graph interpretation, scientific investigation, and communication technology. Students identify data, predictions, variables, and graphs; recognize bar, line plot, and pie graphs; find an outlier; read a value from a line plot; interpret a percentage; and identify what students observe in NASA’s S’COOL program. The worksheet uses 13 multiple-choice questions, one ordering task, and one dropdown item.
Students also apply their understanding of communication by arranging communication forms from oldest to newest, explaining why the telegraph became popular, identifying how technology affects communication, and selecting a way to communicate when phones and electricity are unavailable. These varied items help teachers check whether students can interpret represented data and apply science concepts to real-world observation and communication situations. The worksheet includes a complete answer key for efficient review and grading.
Worksheet settings
Font size
S
M
L
XL
Worksheets
Data & Graphs ( SW 2& 17)
Total questions: 15
Name
Class
Date
1.
is information gathered by observation, questioning, or measurement.
a)
answers
b)
data
c)
predictions
d)
hypothesis
2.
The reason for collecting data is so that you can find a pattern and match it with a
a)
mouse
b)
scientist
c)
prediction
d)
average
3.
What type of graph is this?
a)
pet survey
b)
pie
c)
line plot
d)
bar
4.
Which pet is the outlier?
a)
dog
b)
cat
c)
bird
d)
fish
5.
What is a graph?
a)
picture of math
b)
picture of science
c)
picture of data
d)
picture of squares
6.
What type of graph is this?
a)
bar
b)
pie
c)
line plot
d)
pictograph
7.
How many books have 150 pages?
a)
5
b)
7
c)
4
d)
6
8.
What type of graph is this?
a)
pie
b)
graph
c)
bar
d)
pictograph
9.
What percentage of students want to play basketball?
a)
30
b)
44
c)
8
d)
18
10.
_____________ are parts of the test that change.
a)
commons
b)
variable
c)
questions
11.
NASA asks for help from students to observe and record data through their S'COOL program. What is it that students observe?
a)
clouds
b)
teachers
c)
frog
d)
rivers
12.
Each advancement in technology makes communication______
a)
faster
b)
longer
c)
slower
d)
worse
13.
Reorder the following
Sort these forms of communication from oldest to newest.
a)
b)
c)
d)
1)
2)
3)
4)
14.
Why was the telegraph so popular?
a)
It was a fad for the rich
b)
Messages were delivered instantly
c)
trains carried it faster
d)
everyone loved horses
15.
All phones and electricity stop working during a windstorm. (a) would be a good way to communicate with a neighbor without going outside
Choose from the below words
light
sound
text
email
Answer Key
Data & Graphs ( SW 2& 17)
Total questions: 15
1.
b)
data
2.
c)
prediction
3.
d)
bar
4.
c)
bird
5.
c)
picture of data
6.
c)
line plot
7.
d)
6
8.
a)
pie
9.
d)
18
10.
b)
variable
11.
a)
clouds
12.
a)
faster
13.
b, a, c, d
14.
b)
Messages were delivered instantly
15.
light
140 %
Browse by subjects
Browse by grades
Browse by format
FAQs
What does the Data & Graphs worksheet cover?
This Grade 4 science worksheet combines data literacy with applications of science and technology. Its 15 items ask students to define data and variables, connect collected data to predictions, identify bar, line plot, and pie graphs, interpret an outlier, a line-plot value, and a percentage, and apply communication concepts through ordering, multiple-choice, and dropdown questions.
How can I use this worksheet to teach data interpretation and communication technology?
Introduce the data section by having students distinguish observations or measurements from predictions and identify the parts that can change in a test. Then model how to read the graph types, locate a value or outlier, and interpret a percentage before students complete the multiple-choice items. Use the ordering and communication questions afterward to discuss how communication has changed, why the telegraph mattered, and how people could communicate during a windstorm without phones or electricity.
What mistakes should I watch for when students complete this worksheet?
Students may confuse data with a prediction, or identify the graph’s subject instead of its type when answering the graph questions. Watch for misreading the line plot when finding the number of books with 150 pages, treating the outlier as the most common pet, and confusing a variable with a test question. In the communication items, students may put forms in the wrong historical order or choose text or email even though the windstorm scenario removes phone and electricity access.
How do I assign and grade this Data & Graphs worksheet?
The worksheet is available as a printable PDF and as a digital quiz on Wayground, with a complete answer key for all 15 items. You can grade printable student work by scanning it with the Wayground for Teachers app, while the digital version supports online completion and grading.
How can I differentiate this worksheet for my students?
Use the worksheet’s Advanced Settings to adjust font spacing or choose a larger font size so the graph-identification, ordering, and dropdown items are easier to navigate. You can also enable a dyslexia-friendly font or translate the worksheet into another language while keeping its data-and-graphs and communication questions intact.
Where can I find more worksheets like this on Wayground?
Wayground offers a broad collection of free printable worksheets and practice problems across subjects, with downloadable PDFs and answer keys to help students build essential skills and concepts. Browse more resources at https://wayground.com/en-us/worksheets.

 Worksheets


