

Wayground
Sci 6 8.01 Scientific Data - Printable Science Worksheets - Wayground

Sci 6 8.01 Scientific Data

10 questions

6th - 6th Grade

Science

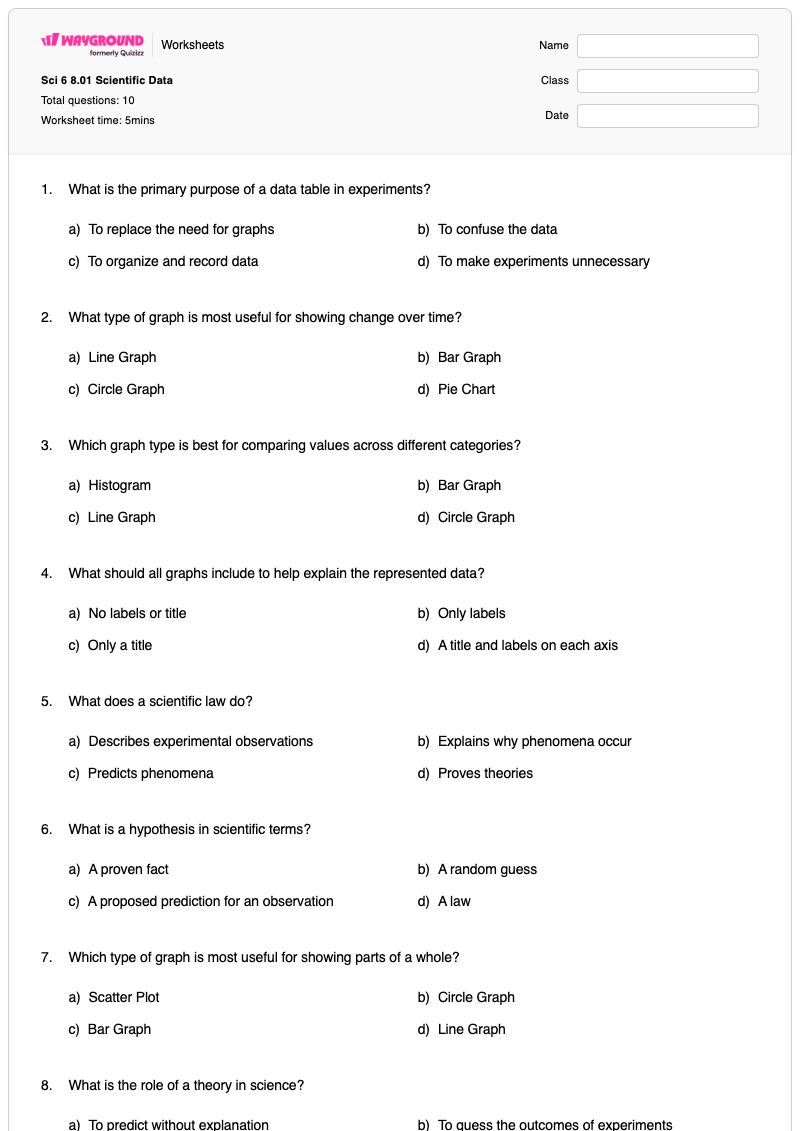
This Grade 6 science worksheet builds foundational scientific data skills through 10 multiple-choice questions. Students identify the purpose of data tables, match line, bar, and circle graphs to the kinds of information they represent, recognize the need for graph titles and labeled axes, and explain how graphs help reveal patterns in experimental data. The worksheet also reviews how scientists use evidence and scientific explanations. Students distinguish a hypothesis as a proposed prediction, a scientific law as a description of observations, and a theory as an explanation for a wide range of observations. This free printable worksheet is useful for introducing or reviewing scientific data analysis and key science terminology, and it includes a complete answer key for efficient checking.

Worksheet settings

Font size

S
M
L
XL
Worksheets

Sci 6 8.01 Scientific Data

Total questions: 10

Name
Class
Date
1.

What is the primary purpose of a data table in experiments?

a)

To replace the need for graphs

b)

To confuse the data

c)

To organize and record data

d)

To make experiments unnecessary

2.

What type of graph is most useful for showing change over time?

a)

Line Graph

b)

Bar Graph

c)

Circle Graph

d)

Pie Chart

3.

Which graph type is best for comparing values across different categories?

a)

Histogram

b)

Bar Graph

c)

Line Graph

d)

Circle Graph

4.

What should all graphs include to help explain the represented data?

a)

No labels or title

b)

Only labels

c)

Only a title

d)

A title and labels on each axis

5.

What does a scientific law do?

a)

Describes experimental observations

b)

Explains why phenomena occur

c)

Predicts phenomena

d)

Proves theories

6.

What is a hypothesis in scientific terms?

a)

A proven fact

b)

A random guess

c)

A proposed prediction for an observation

d)

A law

7.

Which type of graph is most useful for showing parts of a whole?

a)

Scatter Plot

b)

Circle Graph

c)

Bar Graph

d)

Line Graph

8.

What is the role of a theory in science?

a)

To predict without explanation

b)

To guess the outcomes of experiments

c)

To describe observations without explanation

d)

To explain a wide range of observations

9.

How should data from experiments be used by scientists?

a)

To manipulate results

b)

To prove their opinions

c)

To guess outcomes

d)

To draw meaningful conclusions

10.

What is the purpose of creating graphs from experimental data?

a)

To visualize information and see patterns

b)

To complicate simple data

c)

To replace data tables

d)

To disregard numerical data

Answer Key

Sci 6 8.01 Scientific Data

Total questions: 10

1.
c)

To organize and record data

2.
a)

Line Graph

3.
b)

Bar Graph

4.
d)

A title and labels on each axis

5.
a)

Describes experimental observations

6.
c)

A proposed prediction for an observation

7.
b)

Circle Graph

8.
d)

To explain a wide range of observations

9.
d)

To draw meaningful conclusions

10.
a)

To visualize information and see patterns

FAQs

What does this scientific data worksheet cover?

This Grade 6 science worksheet uses 10 multiple-choice questions to assess how students organize experimental data in tables, select appropriate graph types, and interpret the purpose of graphs. It also checks whether students can distinguish hypotheses, scientific laws, and theories and understand that scientists use data to draw meaningful conclusions.

How can I use this worksheet to teach scientific data and graph selection?

Introduce the worksheet by displaying a small data table and asking students which graph would best show change over time, compare categories, or represent parts of a whole. Have students explain their choices using the worksheet’s line graph, bar graph, and circle graph distinctions, then discuss why titles and labeled axes make graphs understandable. Use the final questions to connect visual patterns in data with evidence-based conclusions.

What mistakes should I watch for when students complete this worksheet?

Students may confuse line graphs with bar graphs by choosing a line graph for category comparisons rather than changes over time, or select a circle graph when the data do not show parts of a whole. They may also overlook that graphs need both a title and labels on each axis. In the terminology questions, watch for students treating a hypothesis as a proven fact, a law as an explanation, or a theory as a simple prediction.

How do I assign and grade this scientific data worksheet?

This worksheet is available as a printable PDF and as a digital quiz on Wayground, with a complete answer key included for all 10 multiple-choice questions. Printable submissions can be graded by scanning student work with the Wayground for Teachers app. The printable format also supports classrooms that are reducing screen time.

What scientific terms does this worksheet help students distinguish?

The worksheet asks students to differentiate the roles of a hypothesis, scientific law, and theory in science. Students identify a hypothesis as a proposed prediction, a law as a description of experimental observations, and a theory as an explanation for a wide range of observations.

Where can I find more free worksheets like this on Wayground?

Wayground offers a broad collection of free printable worksheets and practice problems across subjects, with downloadable PDFs and answer keys to support essential skills and concepts. Browse more resources at https://wayground.com/en-us/worksheets.