
30Q
4th - 6th
20Q
7th
5Q
6th
20Q
4th - 5th
15Q
6th
30Q
8th
12Q
1st - 3rd
10Q
6th - 8th
21Q
11th
15Q
5th
12Q
5th - 7th
6Q
6th
10Q
9th - 12th
15Q
7th
20Q
6th - Uni
15Q
Uni
10Q
5th - 6th
8Q
3rd - 6th
13Q
8th - 12th
14Q
3rd
19Q
7th - 8th
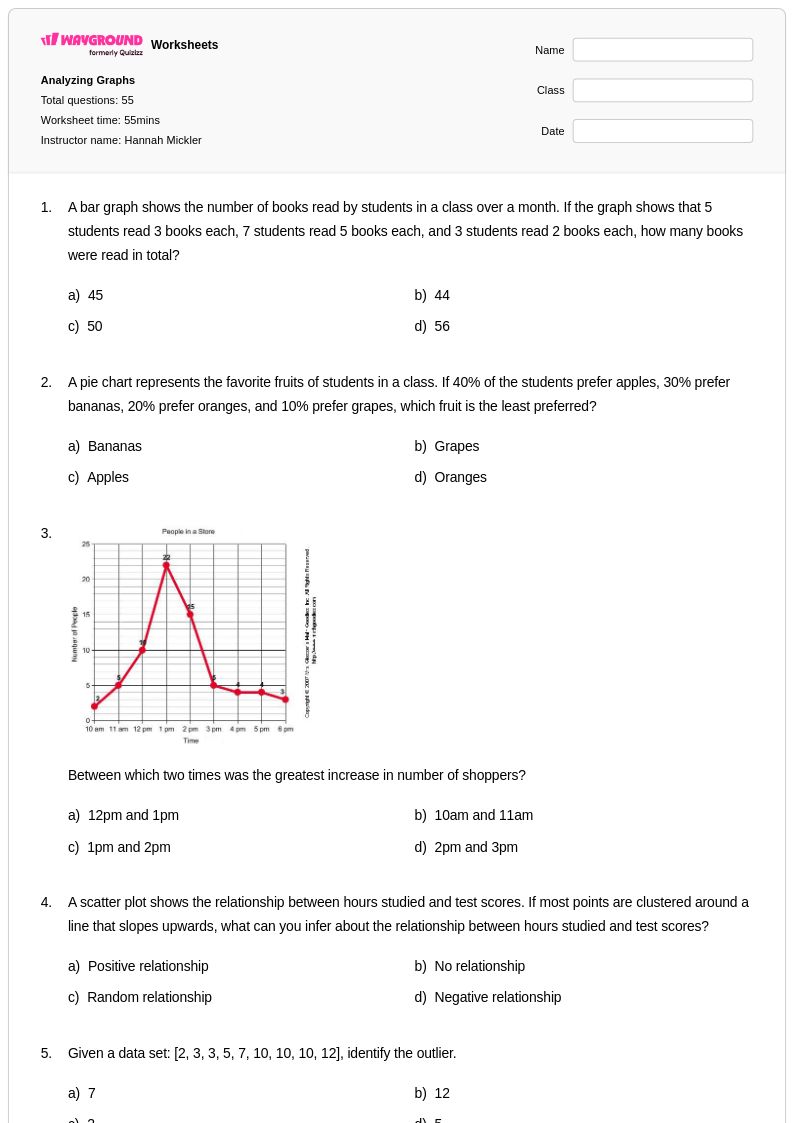
55Q
7th
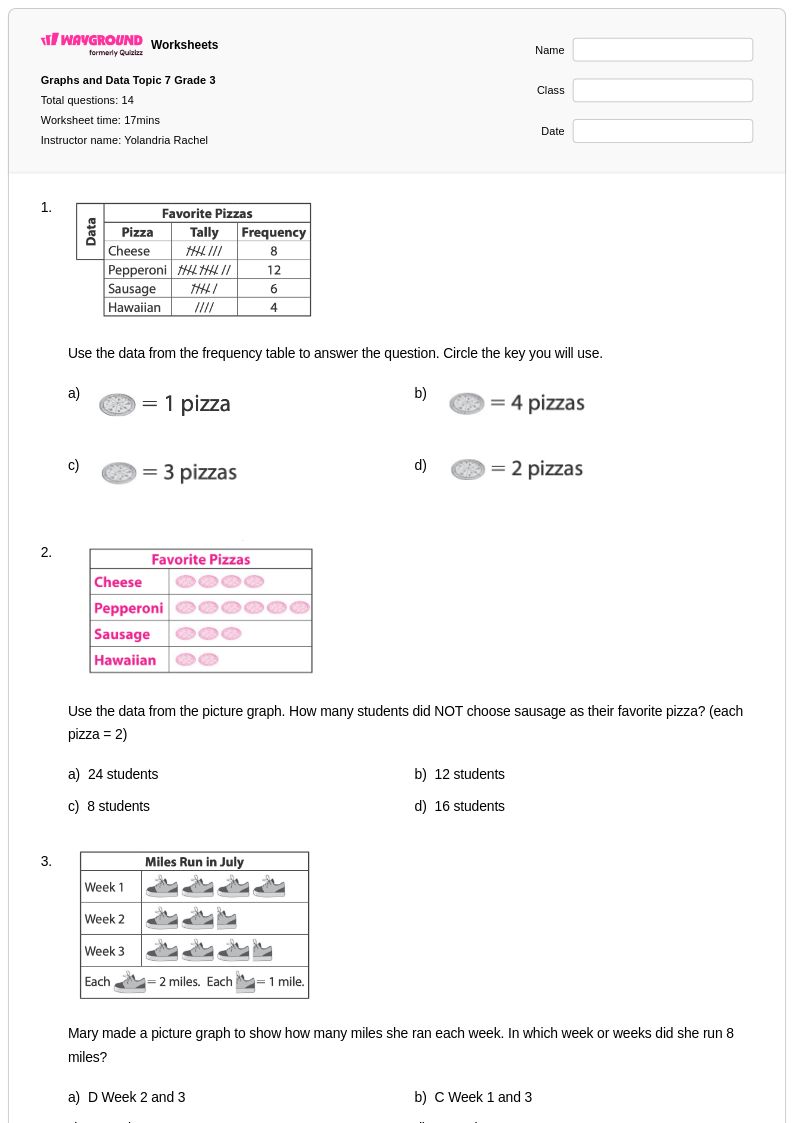
14Q
3rd
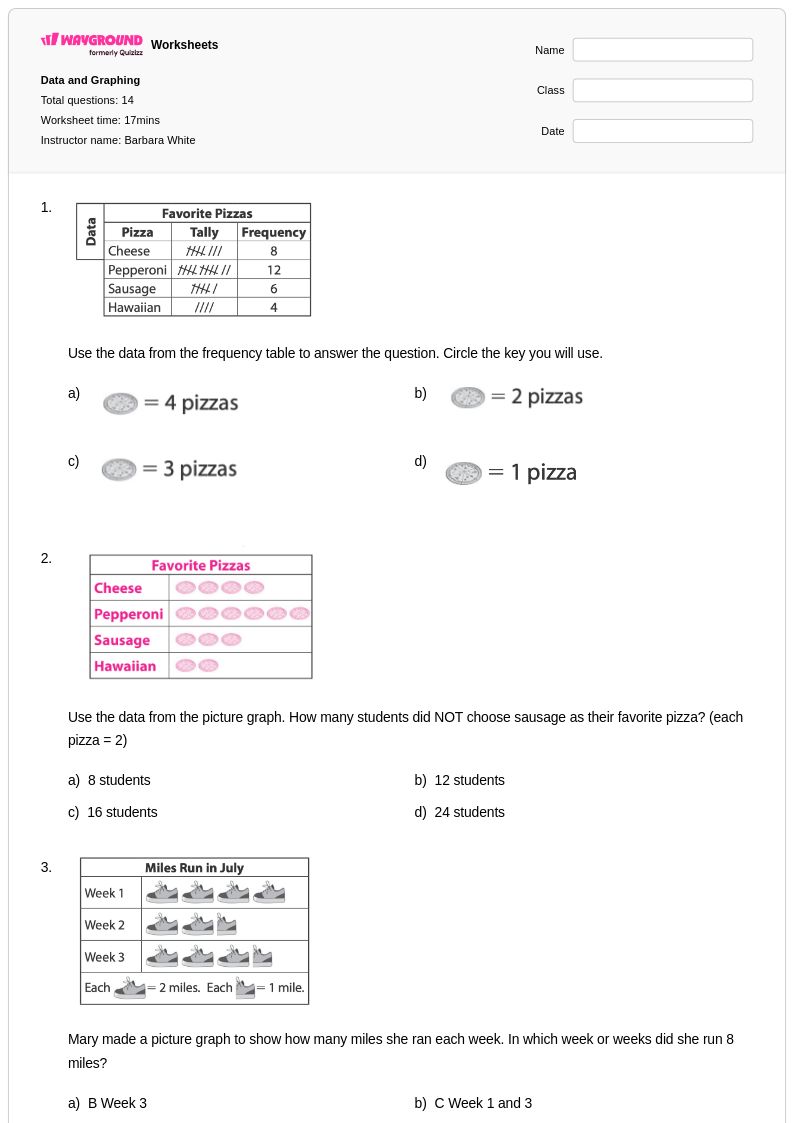
14Q
3rd
Explore planilhas por assuntos
Explore printable Pie Graphs worksheets
Pie graphs worksheets available through Wayground (formerly Quizizz) provide comprehensive practice in one of the most essential data visualization skills in mathematics. These carefully designed resources help students master the fundamental concepts of interpreting, creating, and analyzing circular charts that represent data as proportional sections of a whole. Students develop critical analytical thinking as they work through practice problems that require them to convert raw data into pie chart format, calculate percentages and degrees for each sector, and draw accurate conclusions from existing pie graphs. Each worksheet collection includes detailed answer keys and is available as free printables in convenient pdf format, ensuring educators have immediate access to both student materials and comprehensive solutions for effective instruction and assessment.
Wayground (formerly Quizizz) empowers teachers with an extensive library of millions of teacher-created pie graph resources that streamline lesson planning and enhance student learning outcomes. The platform's robust search and filtering capabilities allow educators to quickly locate worksheets that align with specific curriculum standards and match their students' diverse skill levels. Teachers can customize existing materials or create differentiated versions to support remediation for struggling learners while providing enrichment opportunities for advanced students. Available in both printable and digital formats including downloadable pdfs, these versatile resources integrate seamlessly into any instructional environment, whether for homework assignments, classroom practice, or targeted skill-building sessions that reinforce data interpretation and graphing competencies.