
Wayground
Probability Review - Printable Mathematics Worksheets - Wayground

Probability Review

20 questions

9th - 12th Grade

Mathematics

Probability Review is a mathematics worksheet for Grades 9–12 that strengthens students’ ability to analyze compound and conditional probability. Across 20 questions—18 multiple choice and 2 fill-in-the-blank items—students work with standard decks of cards, dice, marbles, and student preference data to identify dependent events, calculate probabilities of “or” events, and express conditional probabilities as fractions. The worksheet also uses Venn diagrams to interpret unions, intersections, complements, and regions such as one category but not another. Students must select appropriate probability expressions, calculate outcomes from counts, and read diagram data accurately rather than relying only on formulas. This free printable worksheet with an answer key works well for Grade 9–12 review, independent practice, or a check of students’ readiness to solve compound-probability problems.

Worksheet settings

Font size

S
M
L
XL
Worksheets

Probability Review

Total questions: 20

Name
Class
Date
1.

If you are picking two cards randomly from a deck of cards, the events of picking a jack and then picking a heart are ...

a)

Dependent Events

b)

Independent Events

2.
If you draw one card from a standard deck, what is the probability of drawing a spade or a red card?
a)
13/52
b)
26/52
c)
39/52
d)
Not possible
3.
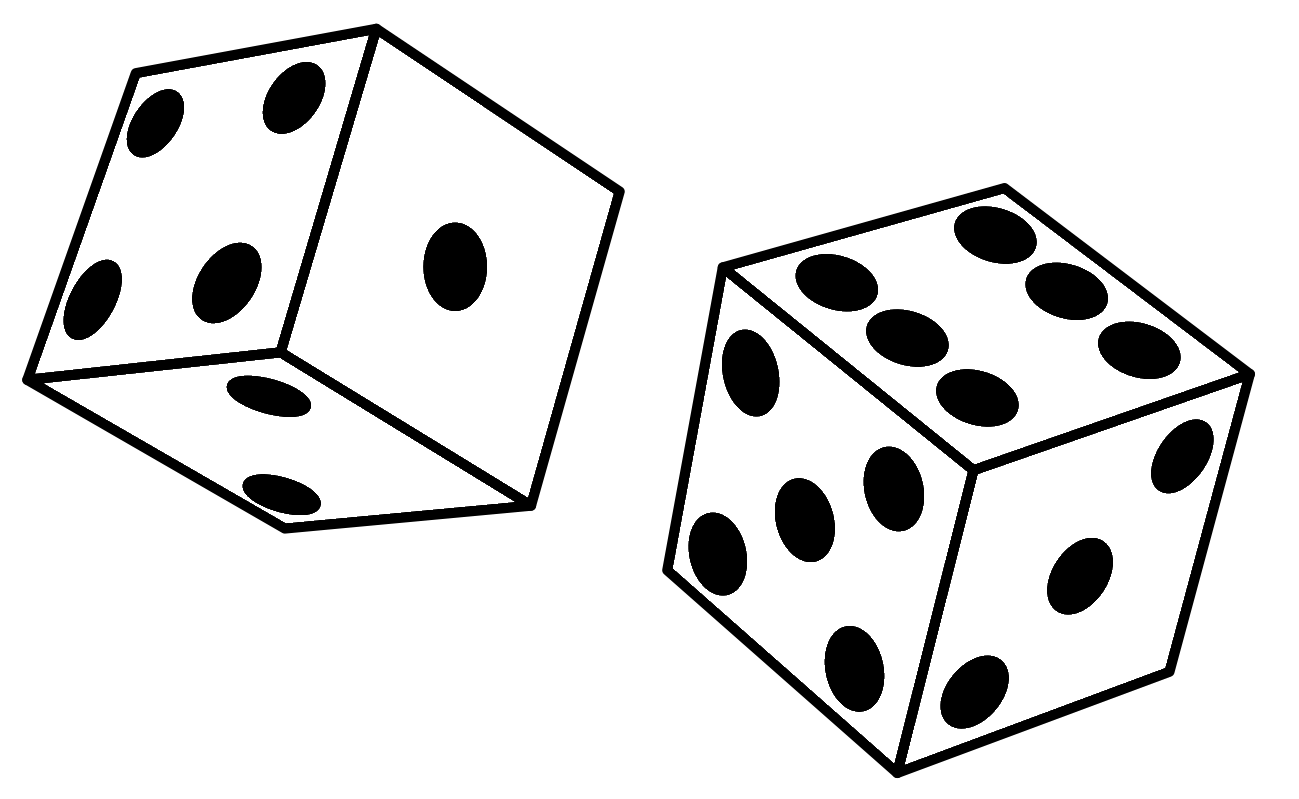
If you roll one die, what is the probability of getting an odd number or a 4?
a)
2/3
b)
1/3
c)
1/2
d)
1/6
4.
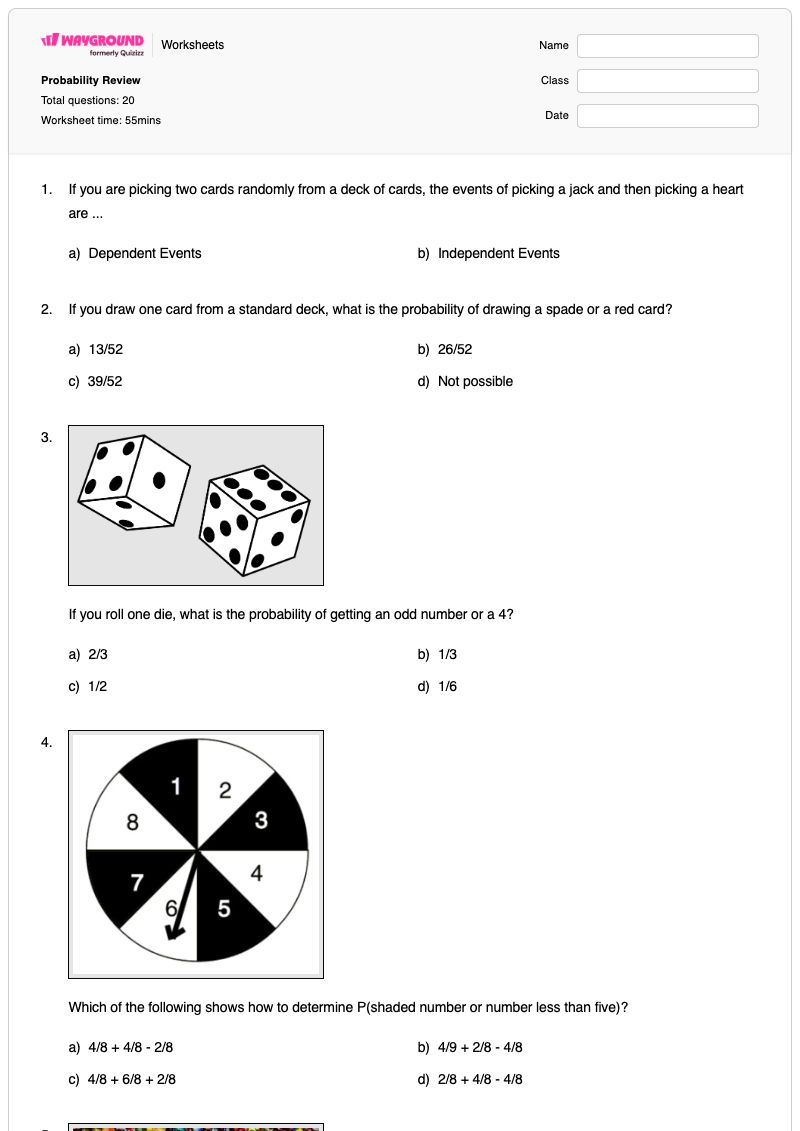
Which of the following shows how to determine P(shaded number or number less than five)?
a)
4/8 + 4/8 - 2/8
b)
4/9 + 2/8 - 4/8
c)
4/8 + 6/8 + 2/8
d)
2/8 + 4/8 - 4/8
5.
A bag contains 9 green marbles, 5 yellow marbles and 6 red marbles.  You choose one marble.   What is the probability of selecting a green or red marble?
a)
8/15
b)
6/11
c)
3/4
d)
2/3
6.
Which of the following shows how to determine P(diamond or face card)?
a)
13/52 + 12/52 - 3/52
b)
3/52 + 13/52 -12/52
c)
3/52 + 12/52 - 13/52
d)
1/13 + 3/52 - 1/4
7.

What is the probability that a randomly selected student prefers athletics given that the student prefers math? Leave as a fraction.

a)

       12\frac{1}{2}  

b)

       310\frac{3}{10}  

c)

      49\frac{4}{9}  

d)

      29\frac{2}{9}  

8.

What is the probability that a randomly selected student wants to be a therapist given that the student has a fear of snakes? Leave as a fraction.

a)

        611\frac{6}{11}  

b)

        13\frac{1}{3}  

c)

       311\frac{3}{11}  

d)

       310\frac{3}{10}  

9.
A die is rolled.  What is the probability of rolling a 5 or a number greater than 3?
a)
2/3
b)
1/2
c)
5/6
d)
1
10.

The diagram shows the sports played by 80 students.


If a student is picked at random, what is the probability that they play football?

a)

33/40

b)

1/20

c)

9/40

d)

49/80

11.

According to the Venn diagram, how many students do not snowboard?

a)
21
b)
22
c)
28
d)
29
12.

The Venn diagram shows the number of senior boys who play football or wrestle.

How may senior boys wrestle, but do not play football?

a)

12

b)

21

c)

27

d)

104

13.

The Venn diagram shows the number of people at the gym signed up for yoga or aerobics class.

How many people are signed up for yoga and aerobics?

a)

68

b)

24

c)

183

d)

92

14.

The Venn diagram shows the number of sophomores with Facebook, Twitter, and Instagram accounts.

How many students have Instagram or Facebook?

(a)  

15.

The Venn diagram shows the number of New Yorkers who ice skate, ski, or snowboard.

How many New Yorkers snowboard or ski?

(a)  

16.

What is the probability that a person who likes Toyota is a female?

P(female|Toyota)

a)
.525
b)
.4627
c)
.6774
d)
.3143
17.

Out of the sophomores who were surveyed about their favorite pets, what percentage liked cats best?

a)

26%

b)

18%

c)

41%

d)

36%

18.

What percentage of the class failed the test?

a)

33.3%

b)

63.3%

c)

85%

d)

52.6%

19.

Out of the juniors, what is the probability of liking vanilla best?

a)

13/20

b)

7/20

c)

7/13

d)

7/40

20.

Determine if events A & B are independent.

P(A) = 0.4 P(B) = 0.6 and P(A & B) = 0.24

a)

Independent because P(A)+P(B)=P(A&B)

b)

Independent because P(A)xP(B)=P(A&B)

c)

Dependent because P(A)+P(B) does not equal P(A&B)

d)

Dependent because P(A)xP(B) does not equal P(A&B)

Answer Key

Probability Review

Total questions: 20

1.
a)

Dependent Events

2.
c) 39/52
3.
a) 2/3
4.
a) 4/8 + 4/8 - 2/8
5.
c) 3/4
6.
a) 13/52 + 12/52 - 3/52
7.
d)

      29\frac{2}{9}  

8.
c)

       311\frac{3}{11}  

9.
b) 1/2
10.
a)

33/40

11.
c) 28
12.
a)

12

13.
b)

24

14.
287
15.
40
16.
c) .6774
17.
d)

36%

18.
a)

33.3%

19.
b)

7/20

20.
b)

Independent because P(A)xP(B)=P(A&B)

FAQs

What does the Probability Review worksheet cover?

This worksheet develops compound-probability skills through 18 multiple-choice questions and 2 fill-in-the-blank items. Students identify dependent events, calculate “or” probabilities with overlapping outcomes, find conditional probabilities as fractions, and interpret Venn diagrams to determine unions, intersections, and category counts.

How can I use this worksheet to teach compound and conditional probability?

Introduce the worksheet by reviewing how outcomes can overlap in examples such as drawing a spade or a red card, then model subtracting the intersection once when applying the addition rule. Next, use the Venn diagram items to have students identify the relevant region before calculating, and discuss why conditional probability uses the given condition as the reference group.

What mistakes should I watch for when students complete this probability worksheet?

Watch for students adding overlapping events without subtracting their intersection, especially in the card, die, marble, and Venn diagram questions. Students may also use the total population instead of the conditioned group as the denominator, confuse “and” with “or,” or select an entire Venn region when the question asks for one category but not the other.

How do I assign and grade the Probability Review worksheet?

Wayground provides this worksheet as a printable PDF and as a digital quiz, and it includes a complete answer key for the 18 multiple-choice and 2 fill-in-the-blank questions. Printable submissions can be graded by scanning student work with the Wayground for Teachers app.

How can I differentiate this probability worksheet for my students?

Use the worksheet’s Advanced Settings to create an alternate version with more font spacing or a larger font, which can make the probability expressions and Venn diagram questions easier to read. You can also enable a dyslexia-friendly font or translate the worksheet into another language while keeping the card, dice, conditional-probability, and diagram-based practice intact.

Where can I find more worksheets like this on Wayground?

Wayground offers a broad collection of free printable worksheets and practice problems across subjects, with downloadable PDFs and answer keys to support mastery of essential skills and concepts. Browse more resources at https://wayground.com/en-us/worksheets.