

Wayground
Three Circle Venn Diagram Probability (P2) - Printable Mathematics Worksheets - Wayground

Three Circle Venn Diagram Probability (P2)

26 questions

9th - 12th Grade

Mathematics

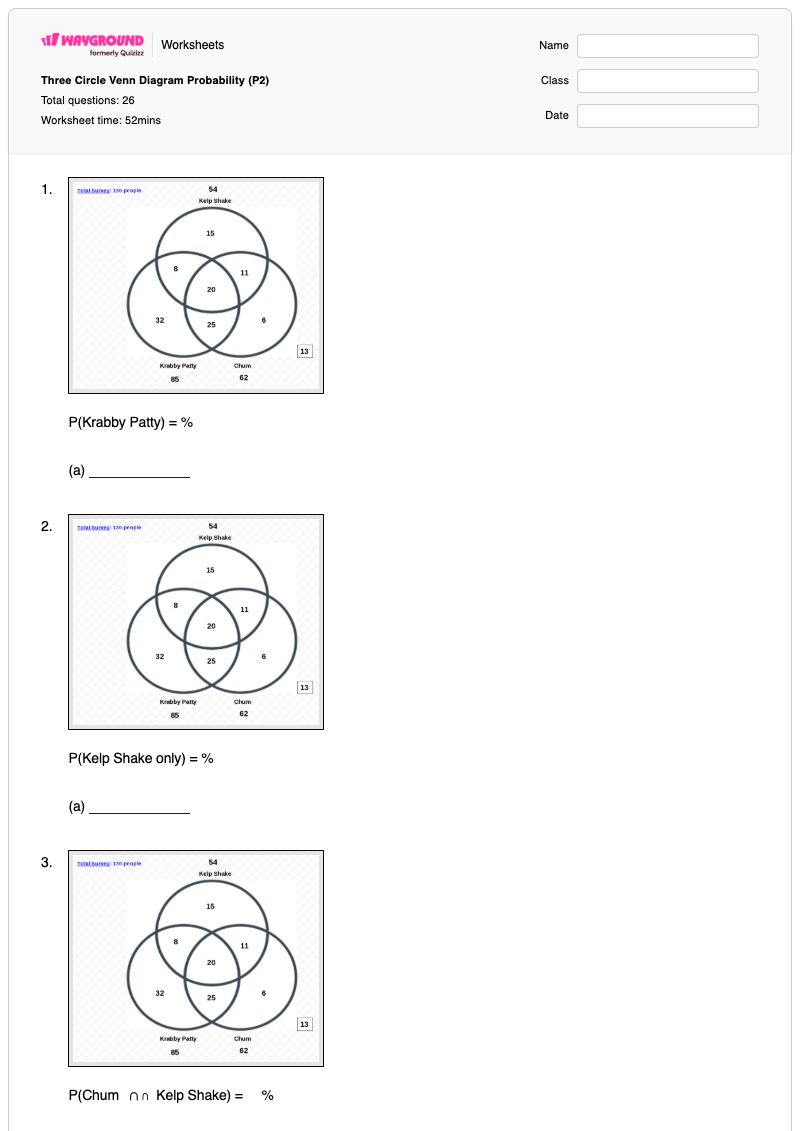
Three Circle Venn Diagram Probability (P2) is a Grade 9–12 mathematics worksheet with 26 fill-in-the-blank questions. Students use a three-circle Venn diagram to calculate probabilities for individual events, “only” regions, intersections, unions, complements such as not Chum, and outcomes involving all three items. The worksheet also includes conditional probability questions such as P(Kelp Shake | Chum) and P(Krabby Patty | Kelp Shake), requiring students to identify the correct conditional sample space. This free printable worksheet gives students focused practice converting Venn diagram regions and event relationships into percentage probabilities. It is useful for independent practice, guided review, homework, or assessment after students have learned set notation and basic probability rules. A complete answer key is included so teachers can check the fill-in responses efficiently and address errors in interpreting unions, intersections, complements, and conditional events.

Worksheet settings

Font size

S
M
L
XL
Worksheets

Three Circle Venn Diagram Probability (P2)

Total questions: 26

Name
Class
Date
1.

P(Krabby Patty) = %

(a)  

2.

P(Kelp Shake only) = %

(a)  

3.

P(Chum  ∩\cap  Kelp Shake) =     %


(a)  

4.

P(not Chum) = %

(a)  

5.

P(Kelp Shake  ∩\cap  Krabby Patty only) =     %


(a)  

6.

P(dislike all three items) = %

(a)  

7.

P(Kelp Shake U Krabby Patty) = %

(a)  

8.

P(Chum) = %

(a)  

9.

P(Kelp Shake | Chum) = %

(a)  

10.

P(Kelp Shake | Krabby Patty) = %

(a)  

11.

P(not Krabby Patty) = %

(a)  

12.

P(Chum only) = %

(a)  

13.

P(Krabby Patty  ∩\cap  Kelp Shake) =     %


(a)  

14.

P(Kelp Shake U Chum) = %

(a)  

15.

P(Krabby Patty | Kelp Shake) = %

(a)  

16.

P(Chum | Krabby Patty) = %

(a)  

17.

P(Kelp Shake) = %

(a)  

18.

P(Kelp Shake  ∩\cap  Chum) =      %


(a)  

19.

P(Krabby Patty  ∩\cap  Chum only) =     %


(a)  

20.

P(not Kelp Shake) = %

(a)  

21.

P(Krabby Patty only) = %

(a)  

22.

P(Krabby U Chum) = %

(a)  

23.

P(Chum | Kelp Shake) = %

(a)  

24.

P(Kelp Shake  ∩\cap  Chum only) =     %


(a)  

25.

P(liked all three items) = %

(a)  

26.

P(Krabby Patty | Chum) = %

(a)  

Answer Key

Three Circle Venn Diagram Probability (P2)

Total questions: 26

1.
65.384, 65.385
2.
11.538, 11.539
3.
23.846, 23.847
4.
52.307, 52.308
5.
6.153, 6.154
6.
10, 10.000, 10.00, 10.0
7.
85.384, 85.385
8.
47.692, 47.693
9.
50, 50.000, 50.00, 50.0
10.
32.941, 32.942
11.
34.615, 34.616
12.
4.615, 4.616
13.
21.538, 21.539
14.
65.384, 65.385
15.
51.851, 51.852
16.
52.941, 52.942
17.
41.538, 41.539
18.
23.846, 23.847
19.
19.230, 19.23, 19.231
20.
58.461, 58.462
21.
24.615, 24.616
22.
78.461, 78.462
23.
57.407, 57.408
24.
8.461, 8.462
25.
15.384, 15.385
26.
72.580, 72.581, 72.58

FAQs

What does the Three Circle Venn Diagram Probability worksheet cover?

This worksheet covers calculating percentage probabilities from a three-circle Venn diagram through 26 fill-in-the-blank questions. Students determine probabilities for individual events, “only” categories, intersections, unions, complements, all-three outcomes, and conditional events such as P(Kelp Shake | Chum).

How can I use this worksheet to teach three-circle Venn diagram probability?

First model how a single region in the three-circle diagram corresponds to an event, then connect “only,” intersection, union, and complement language to the appropriate regions or totals. Use the fill-in-the-blank questions to have students explain which regions form each probability before calculating the percentage. For the conditional items, ask students to identify the event after the vertical bar as the restricted sample space before substituting values.

What mistakes should I watch for when students complete this probability worksheet?

Students may add overlapping regions incorrectly when finding a union, include shared regions in an “only” probability, or use the wrong total when finding a complement such as P(not Krabby Patty). For conditional questions such as P(Kelp Shake | Krabby Patty), watch for students who divide by the overall total instead of by the Krabby Patty group. Because the answers are percentages, also check that students round consistently to the precision accepted by the fill-in options.

How do I assign and grade this Three Circle Venn Diagram Probability worksheet?

On Wayground, assign this worksheet either as a printable PDF or as a digital quiz, and use the complete answer key to check all 26 fill-in responses. For printable submissions, teachers can scan student work with the Wayground for Teachers app to streamline grading. The PDF option also supports classrooms that want to reduce screen time while students practise interpreting the three-circle diagram.

How can I differentiate this three-circle Venn diagram probability worksheet for my students?

Use the worksheet’s Advanced Settings to adjust font spacing and font size so the diagram references and fill-in-the-blank probability prompts are easier to read. You can also apply a dyslexia-friendly font or translate the worksheet into another language when those options better support access to the Venn diagram notation and conditional probability language.

Where can I find more worksheets like this on Wayground?

Wayground offers a broad collection of free printable worksheets and practice problems across subjects, with downloadable PDFs and answer keys to support mastery of essential skills and concepts. Browse more resources at https://wayground.com/en-us/worksheets.