

Wayground
Venn Diagram Probability - Printable Mathematics Worksheets - Wayground

Venn Diagram Probability

20 questions

9th - 10th Grade

Mathematics

Venn Diagram Probability is a Grade 9–10 mathematics worksheet with 20 multiple-choice questions focused on interpreting two- and three-set Venn diagrams. Students identify shaded regions using set notation, including A, B, A′, B′, intersections, unions, and complements, then use values shown in diagrams to determine counts and probabilities for groups such as students who play particular sports or meet multiple conditions. This worksheet helps students connect visual regions with formal probability expressions, distinguish outcomes such as “football” from “football only,” and select the appropriate part of a diagram before calculating a fraction or decimal probability. It is useful for guided practice, independent review, or a quick assessment of set notation and probability reasoning. The free printable worksheet includes a complete answer key for efficient checking.

Worksheet settings

Font size

S
M
L
XL
Worksheets

Venn Diagram Probability

Total questions: 20

Name
Class
Date
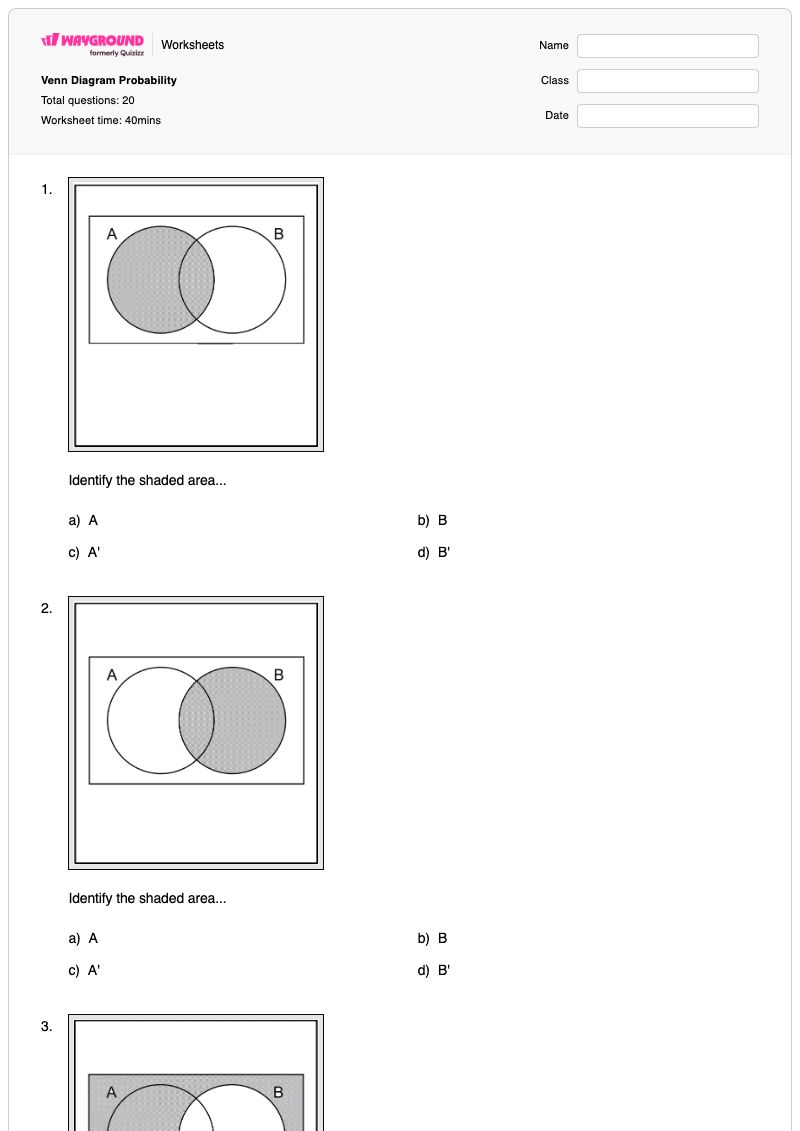
1.

Identify the shaded area...

a)

A

b)

B

c)

A'

d)

B'

2.

Identify the shaded area...

a)

A

b)

B

c)

A'

d)

B'

3.

Identify the shaded area...

a)

A

b)

B

c)

A'

d)

B'

4.

Identify the shaded area...

a)

A

b)

B

c)

A'

d)

B'

5.

Identify the shaded area...

a)

A∩B

b)

A∪B

c)

A'∩B'

d)

A'∪B'

6.

Identify the shaded area...

a)

A∩B

b)

A∪B

c)

A'∩B'

d)

A'∪B'

7.

Identify the shaded area...

a)

A∩B

b)

A∪B

c)

A'∩B'

d)

A'∪B'

8.

The diagram shows the sports played by 80 students.


If a student is picked at random, what is the probability that they play football?

a)

66/80

b)

4/80

c)

18/80

d)

49/80

9.

The diagram shows the sports played by 80 students.


If a student is picked at random, what is the probability that they play football only?

a)

66/80

b)

4/80

c)

18/80

d)

49/80

10.

The diagram shows the sports played by 80 students.


If a student is picked at random, what is the probability that they play all three sports?

a)

31/80

b)

45/80

c)

62/80

d)

67/80

11.
How many senior boys play football and wrestle?
a)
9
b)
12
c)
18
d)
39
12.
How many students took the survey?
a)
32
b)
47
c)
53
d)
56
13.
How many students do not snowboard?
a)
21
b)
22
c)
28
d)
29
14.

What is the probability that someone plays basketball?

a)

.50

b)

.68

c)

.52

d)

.46

15.

Find the probability of getting a red shape.

a)

59\frac{5}{9}

b)

39\frac{3}{9}

c)

13\frac{1}{3}

16.

The venn diagram shows the number of students in chorus, band, and/or orchestra.

How many students are in the orchestra?

a)

16

b)

21

c)

31

d)

36

17.

The venn diagram shows the number of students in chorus, band, and/or orchestra.

How many students are in chorus, band, and orchestra?

a)

5

b)

9

c)

24

d)

15

18.

The venn diagram shows which sports are played by a class of students.

How many students are in the class?

a)

20

b)

25

c)

30

d)

35

19.

The venn diagram shows which sports are played by a class of students.

How many students are taking tennis?

a)

6

b)

11

c)

25

d)

30

20.

The venn diagram shows the number of people in a group of friends who have brown hair and green eyes.

What is the probability of a friend having green eyes?

a)

3

b)

1

c)

2

d)

3/11

Answer Key

Venn Diagram Probability

Total questions: 20

1.
a)

A

2.
b)

B

3.
d)

B'

4.
c)

A'

5.
a)

A∩B

6.
b)

A∪B

7.
c)

A'∩B'

8.
a)

66/80

9.
b)

4/80

10.
a)

31/80

11.
a) 9
12.
c) 53
13.
c) 28
14.
c)

.52

15.
a)

59\frac{5}{9}

16.
d)

36

17.
a)

5

18.
c)

30

19.
b)

11

20.
d)

3/11

FAQs

What does the Venn Diagram Probability worksheet cover?

This Grade 9–10 mathematics worksheet contains 20 multiple-choice questions on reading shaded Venn diagram regions and using set notation such as A, B, A′, B′, A∩B, and A∪B. Students then apply those regions to count-based probability questions, including outcomes such as playing a sport, playing one sport only, or belonging to all three sets.

How can I use this worksheet to teach Venn diagram probability?

Begin by reviewing how shading represents a set, complement, intersection, or union, then have students explain the meaning of each symbol before selecting an answer. Use the later diagram-based questions to model how to identify the relevant region, distinguish an inclusive event from an “only” event, and write its value over the total before simplifying or converting the probability.

What mistakes should I watch for when students complete this Venn diagram worksheet?

Students may confuse A∩B with A∪B, treat A′ or B′ as the set itself, or choose the shaded region without checking what the notation means. In the probability items, watch for students using the count for “football only” when the question asks for everyone who plays football, including overlaps, or using the wrong total as the denominator.

How do I assign and grade this Venn Diagram Probability worksheet?

The worksheet is available as a printable PDF and as a digital quiz on Wayground, and it includes a complete answer key for all 20 multiple-choice questions. For printable submissions, scan student work with the Wayground for Teachers app to grade responses efficiently. The PDF option also supports schools that want to reduce screen time.

How does this worksheet connect Venn diagram regions to probability?

The worksheet moves from identifying shaded regions to using those regions as events in probability calculations. Students must translate visual information into set notation, select the correct count for an event such as an intersection or complement, and pair it with the total population to form a probability.

Where can I find more worksheets like this on Wayground?

Wayground offers a broad collection of free printable worksheets and practice problems across subjects, with downloadable PDFs and answer keys to support essential skills and concepts. Browse more resources at https://wayground.com/en-us/worksheets.