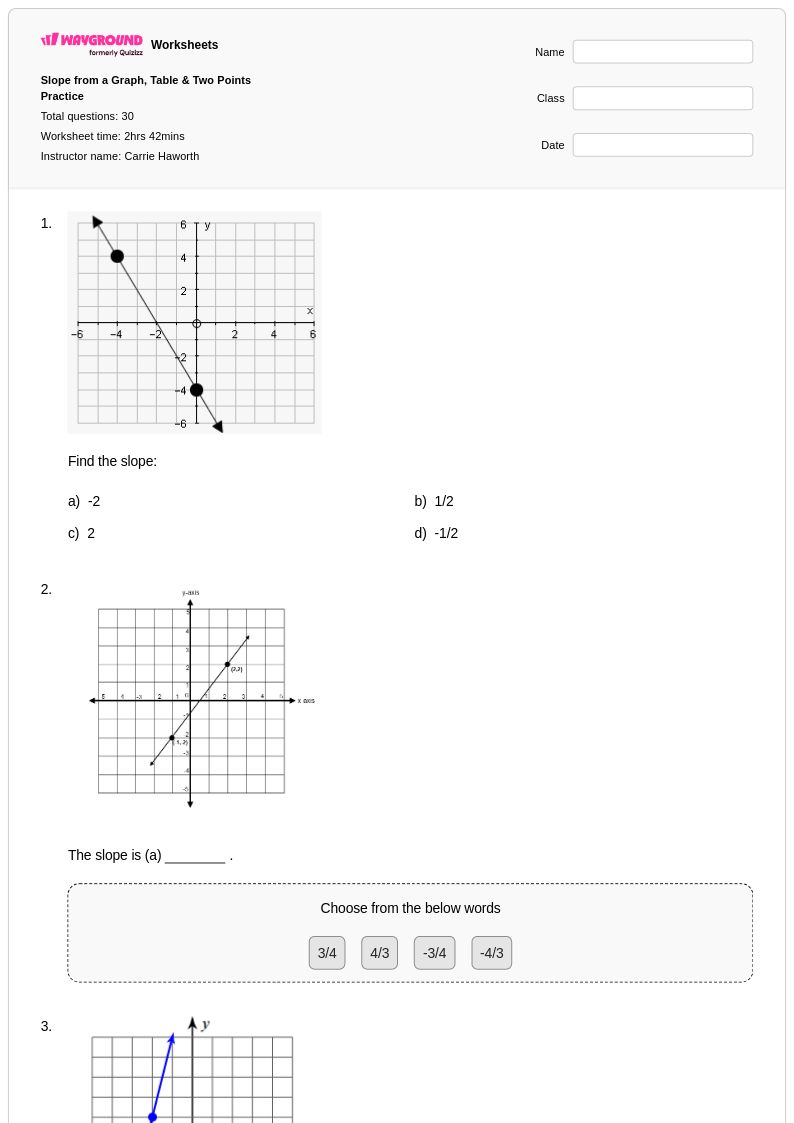
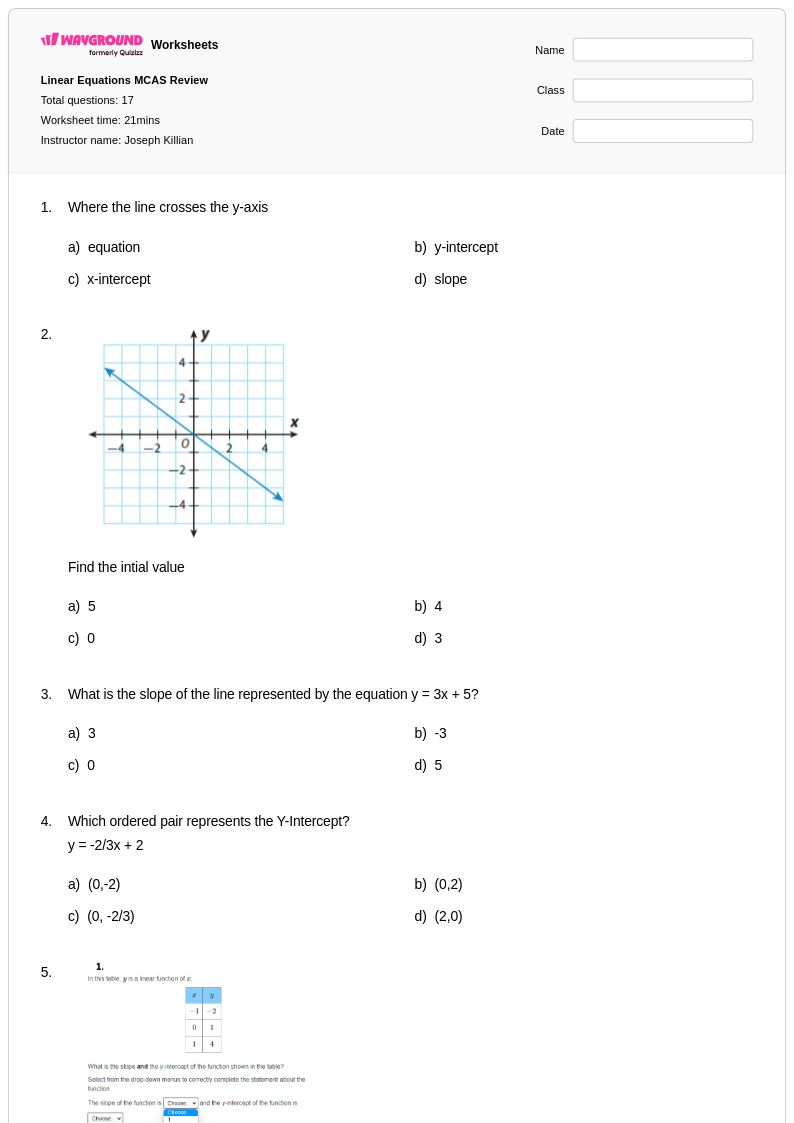
Free Printable Conversion Graphs Worksheets for Class 8
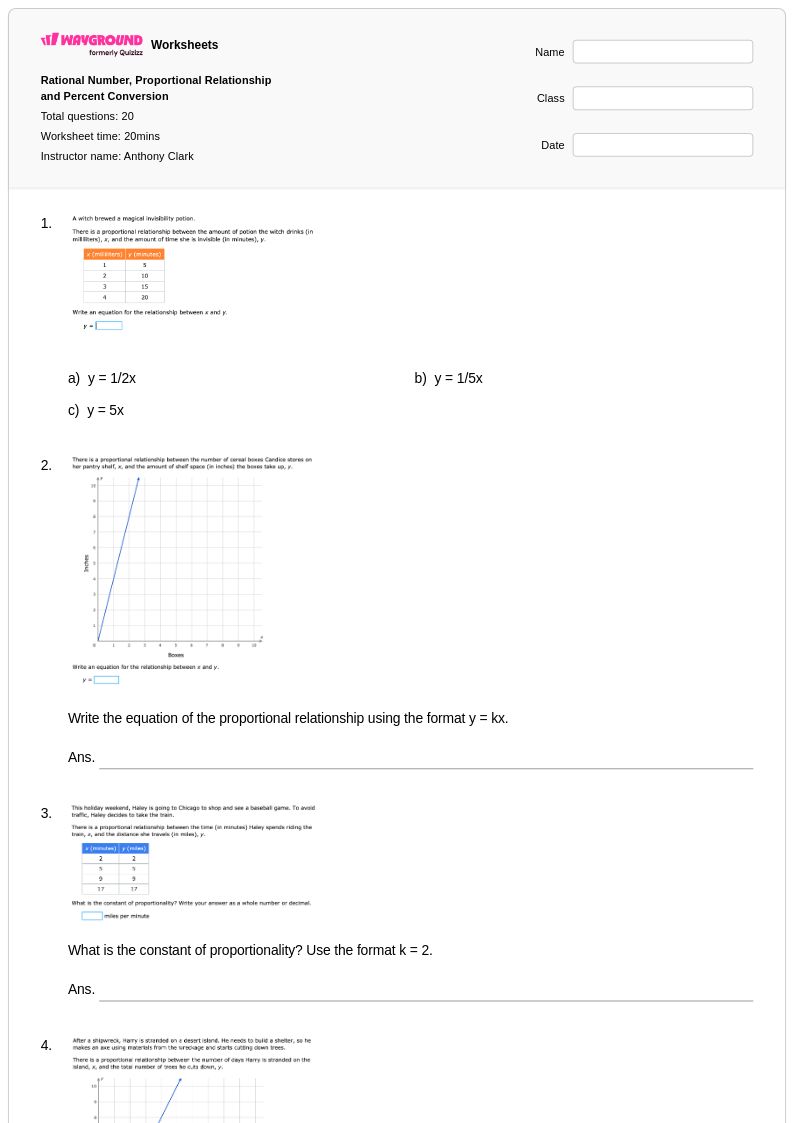
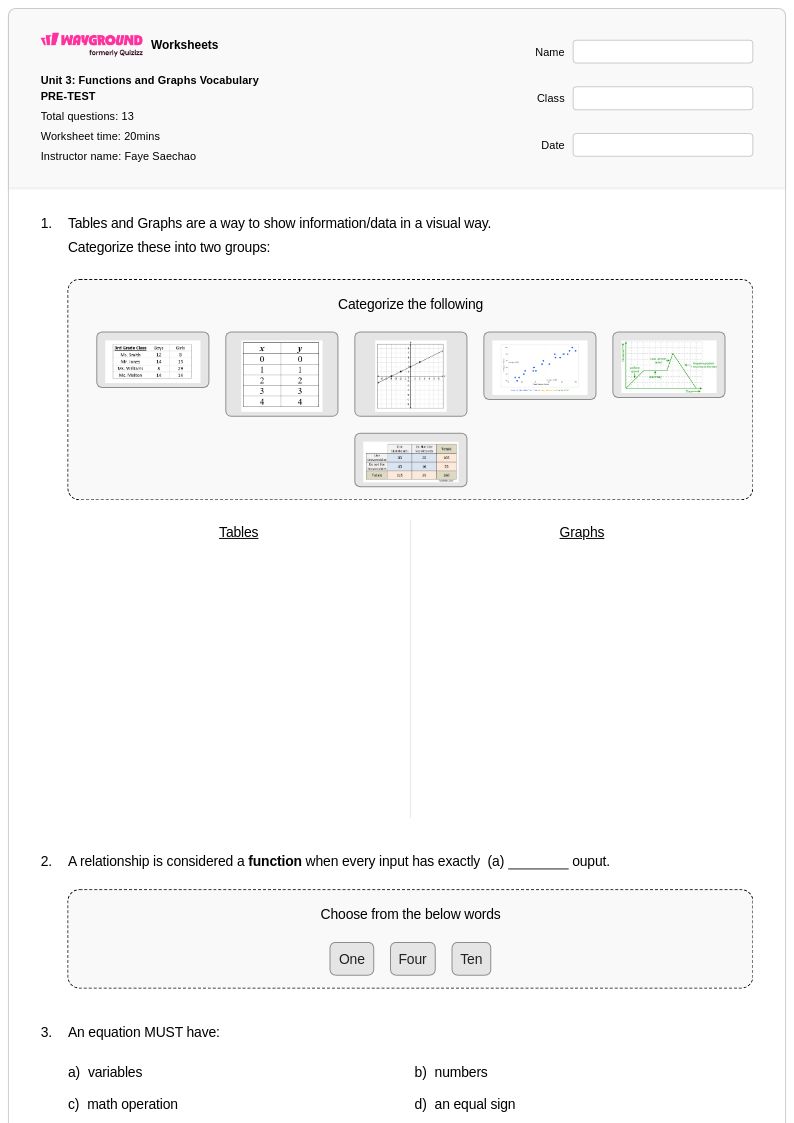
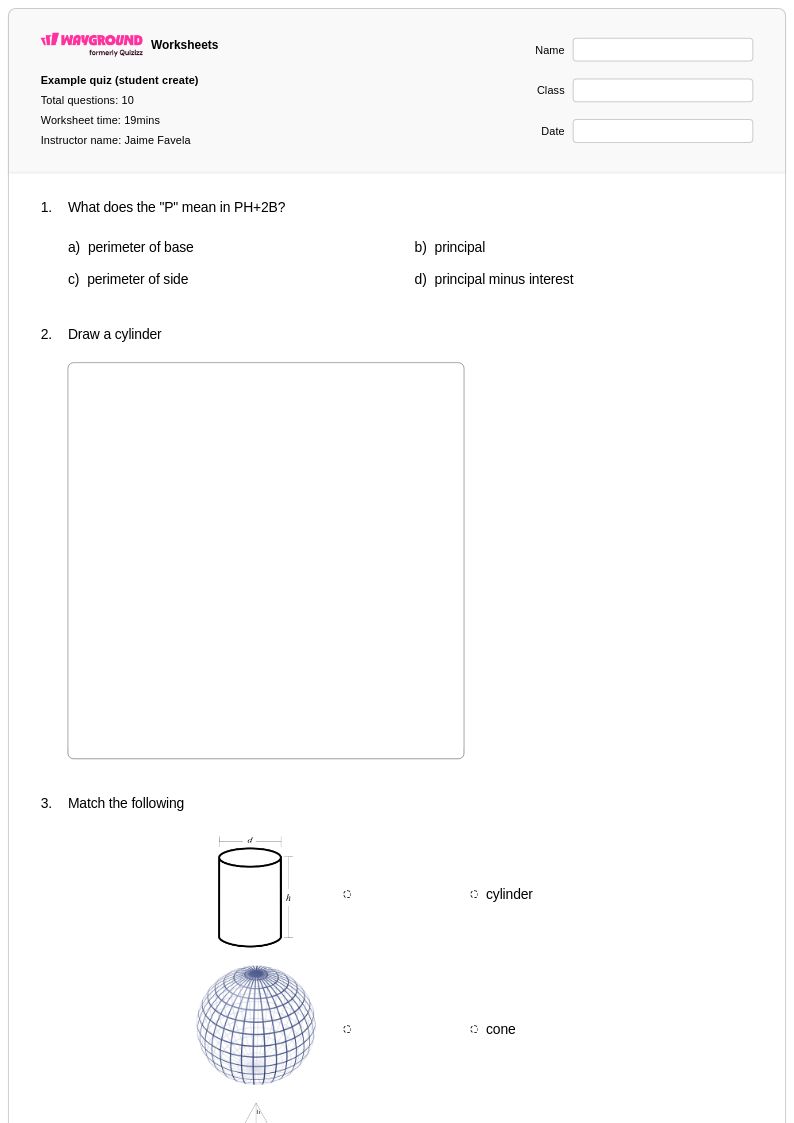
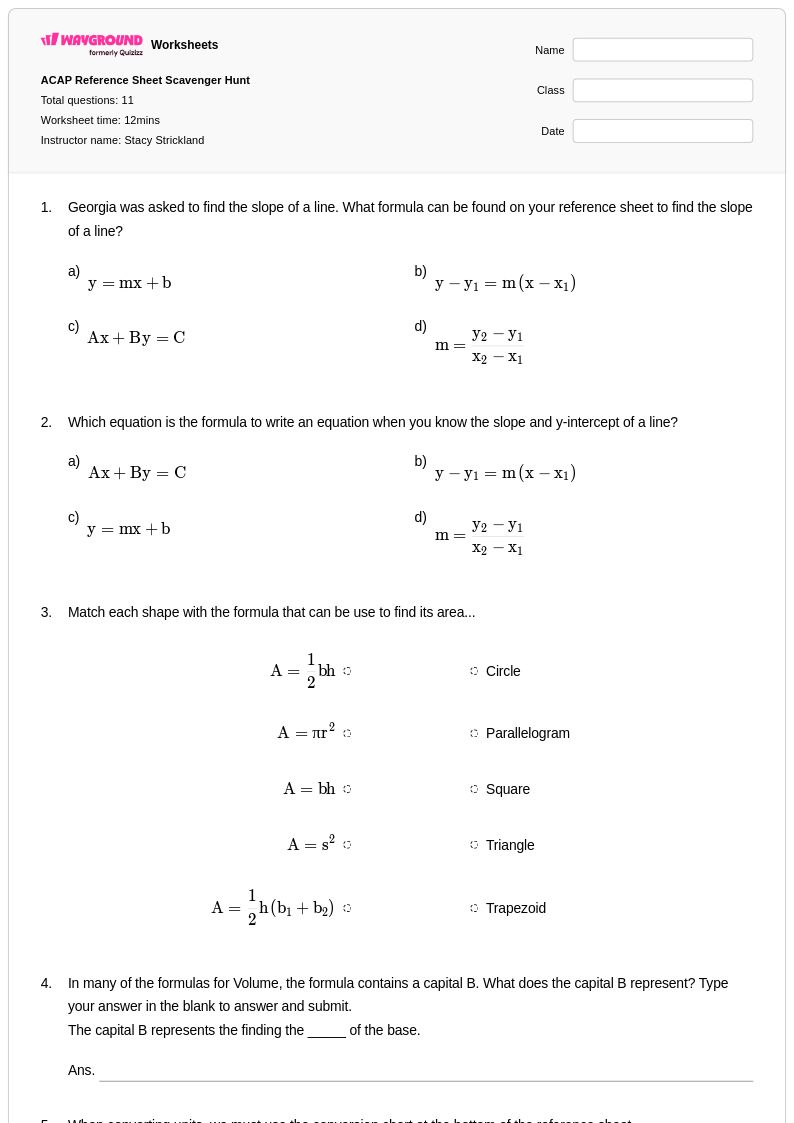
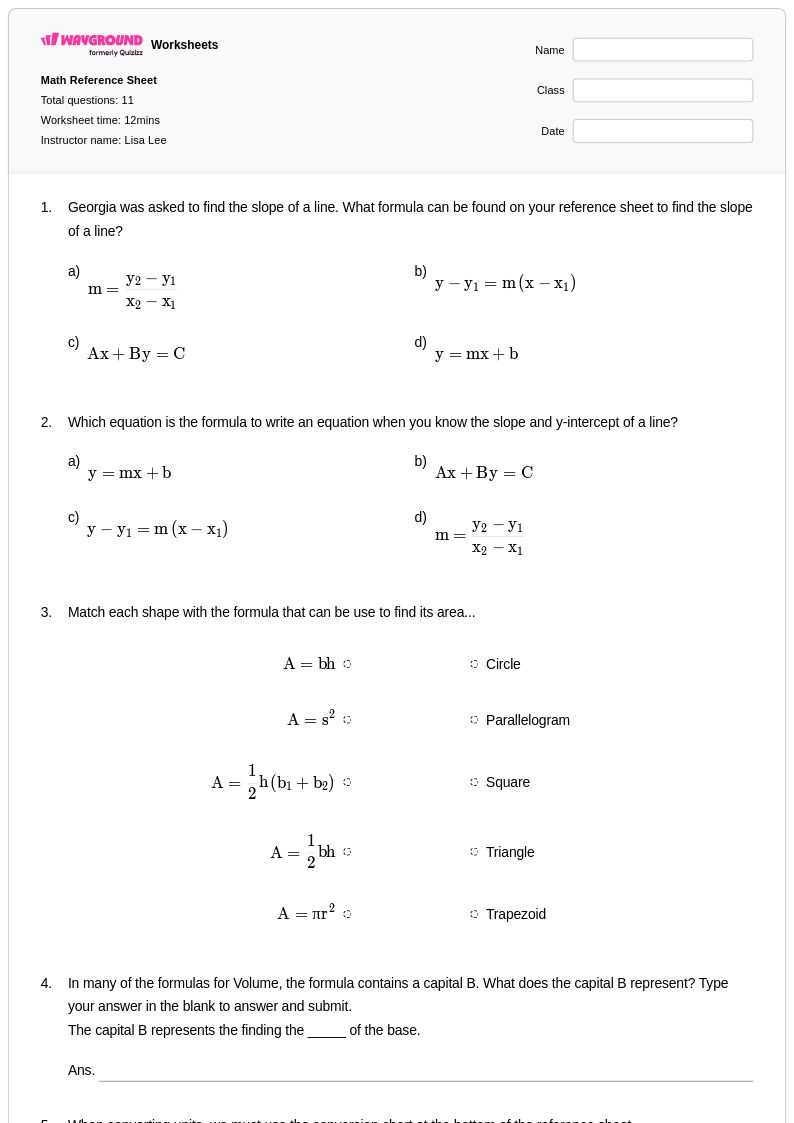
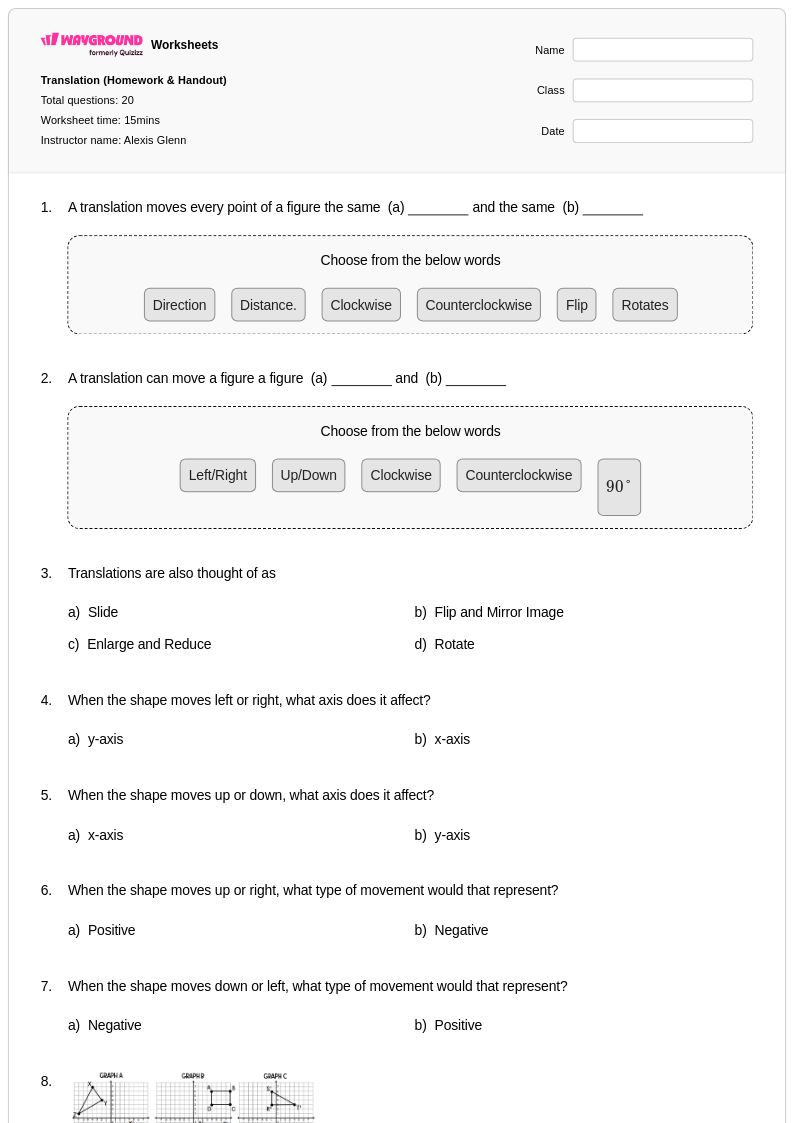
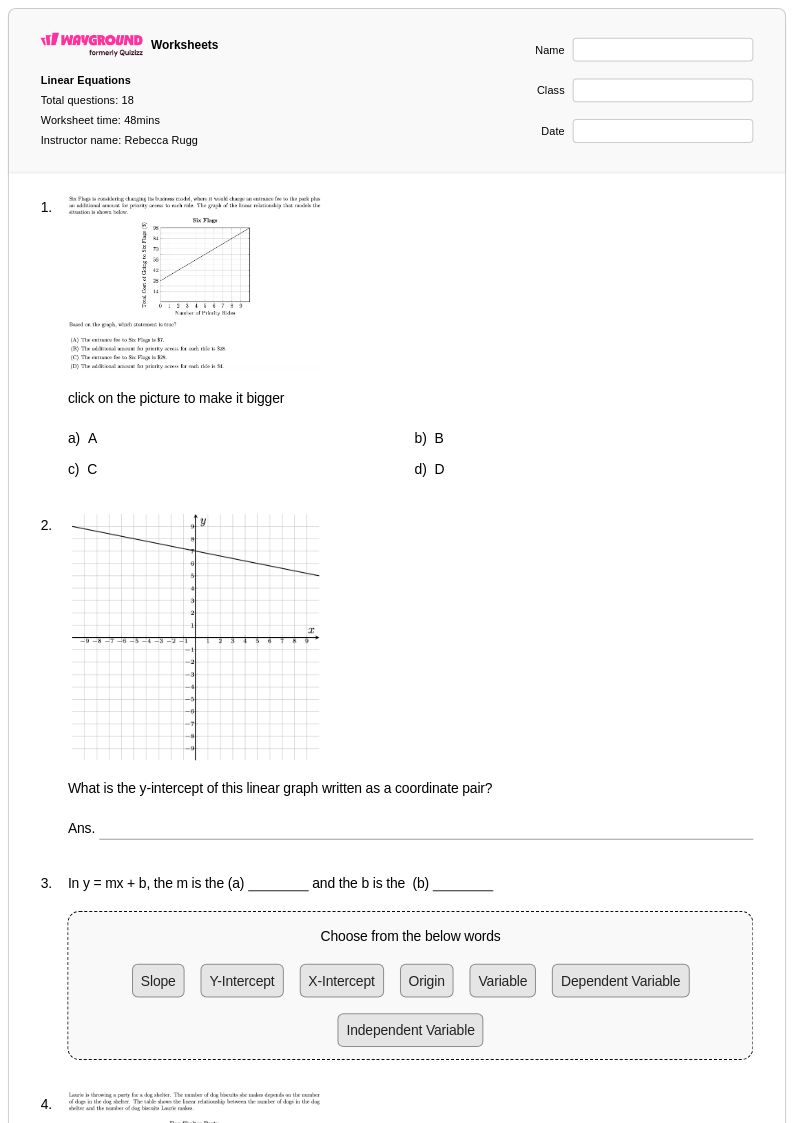
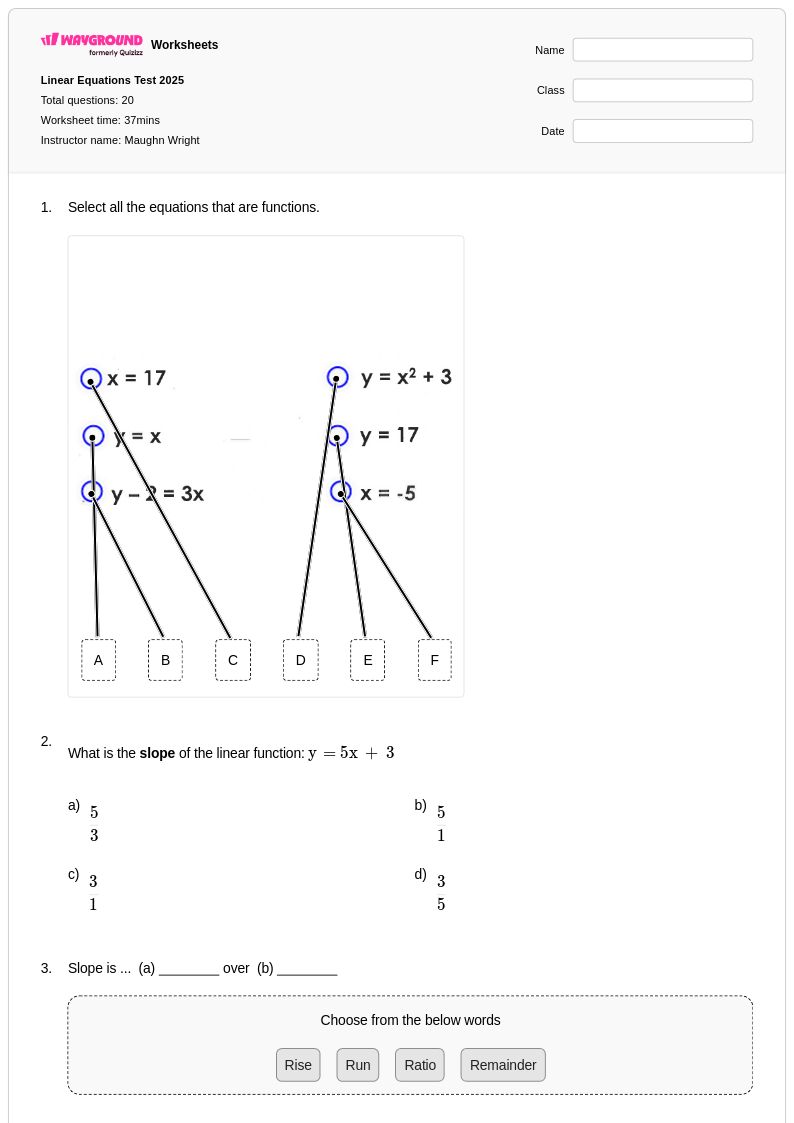
Class 8 conversion graphs worksheets provide free printables and practice problems to help students master reading, interpreting, and creating conversion graphs between different units of measurement with complete answer keys.
Explore printable Conversion Graphs worksheets for Class 8
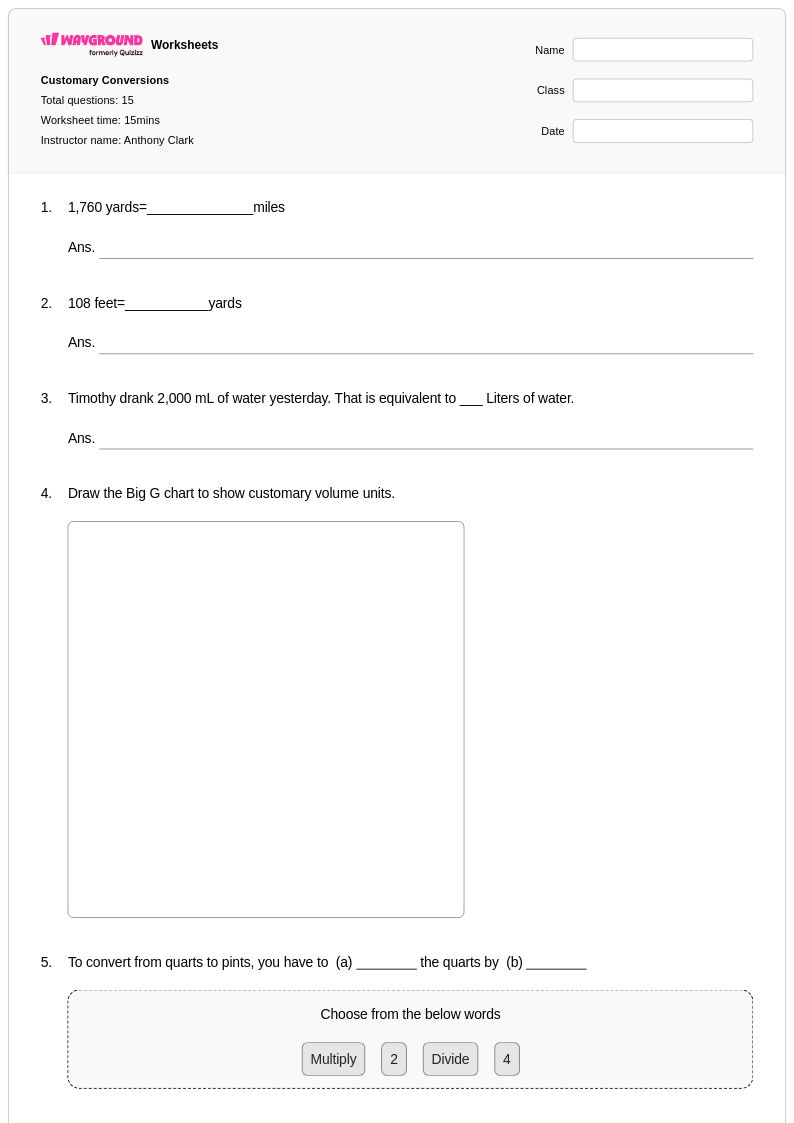
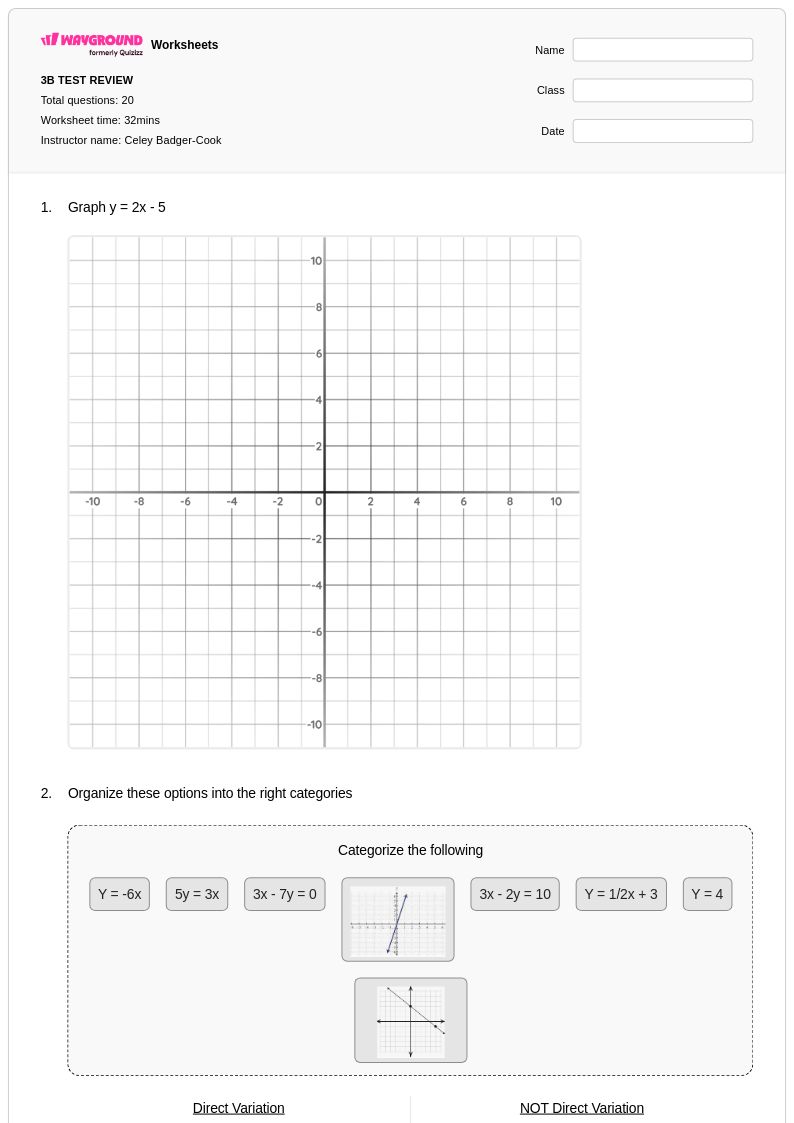
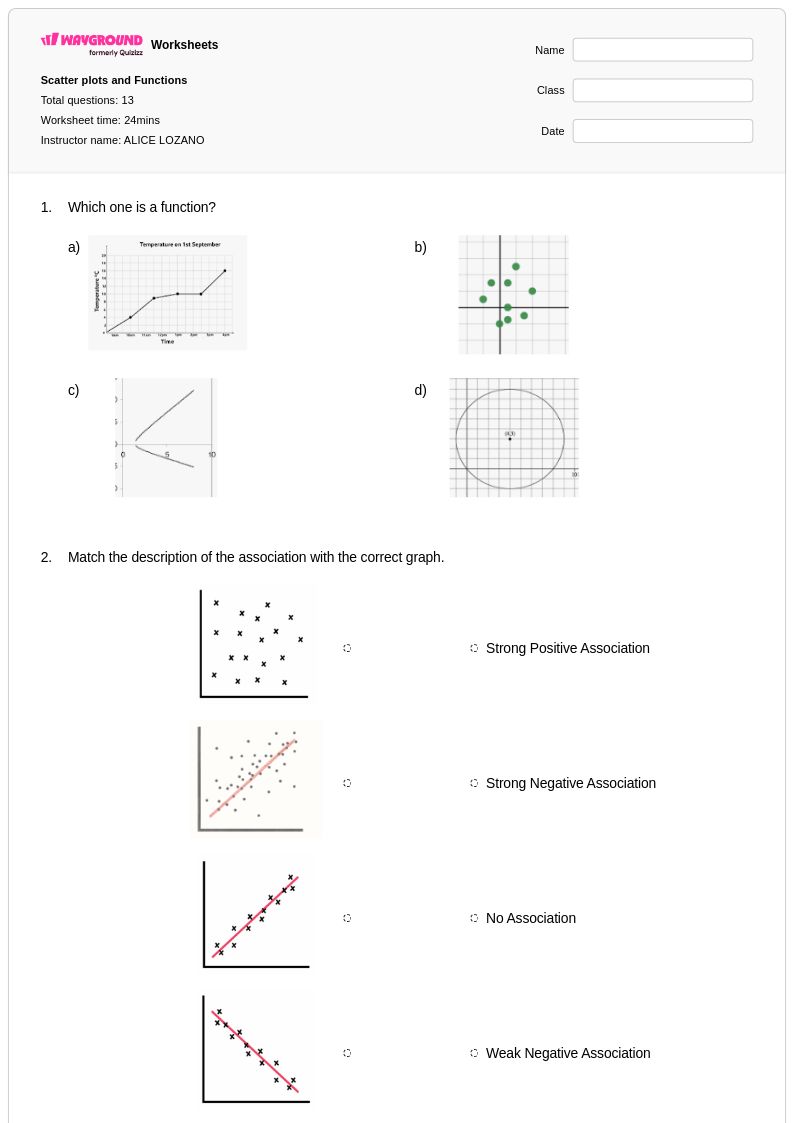
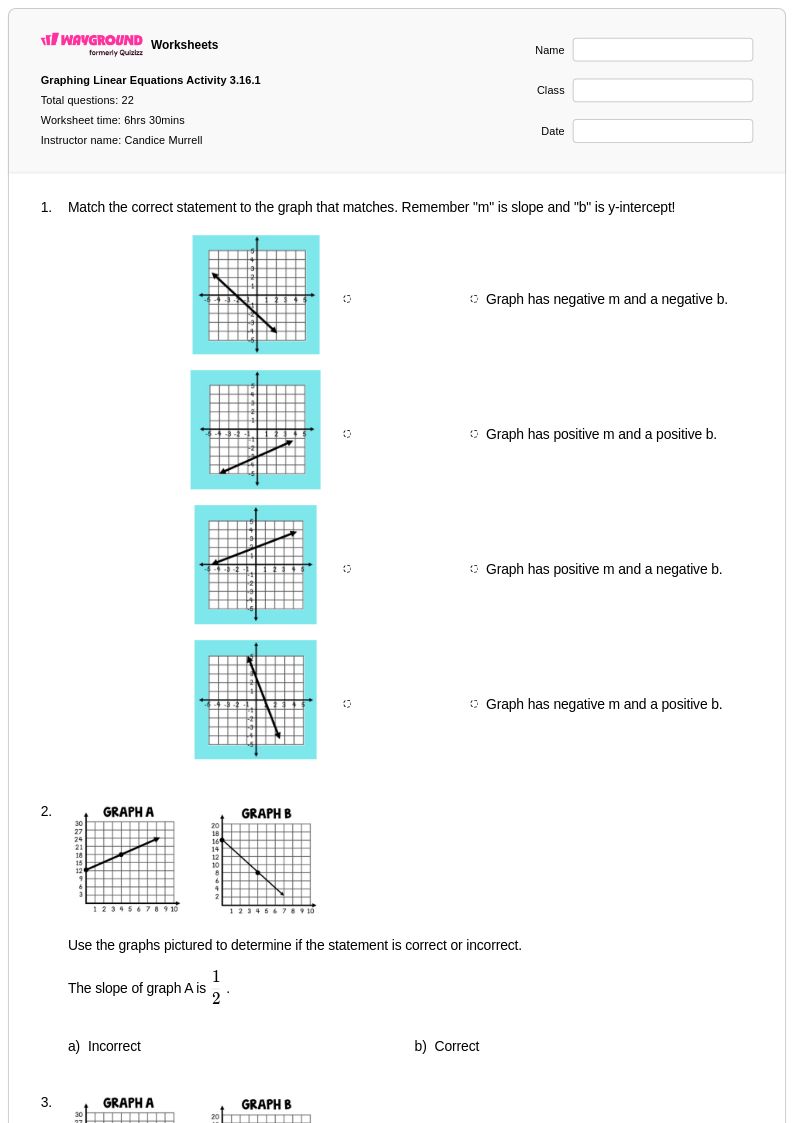
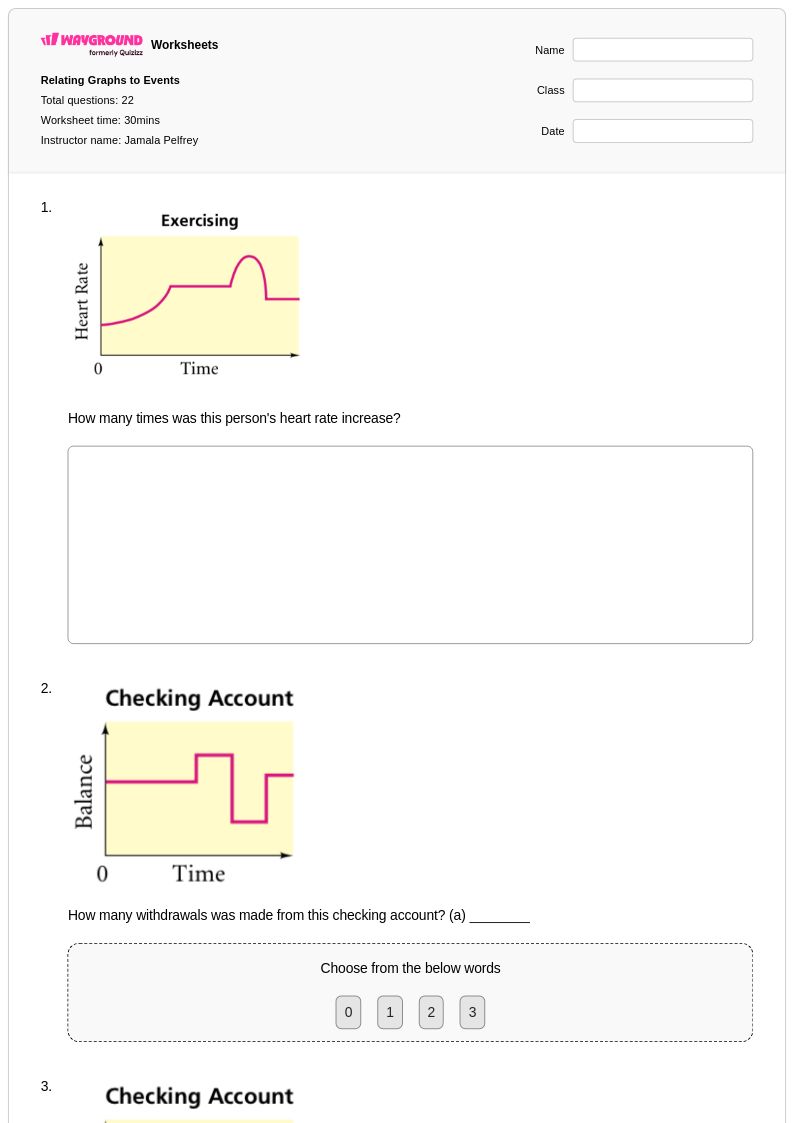
Conversion graphs represent a fundamental skill in Class 8 mathematics that bridges algebraic thinking with practical real-world applications. Wayground's comprehensive collection of conversion graph worksheets provides students with structured practice in reading, interpreting, and creating graphs that show relationships between different units of measurement. These carefully designed resources strengthen critical skills including plotting coordinate points, identifying linear relationships, calculating rates of change, and applying proportional reasoning to solve conversion problems. Each worksheet includes detailed answer keys and step-by-step solutions, making them valuable for both independent practice and guided instruction. Available as free printable pdf downloads, these practice problems cover essential conversions such as currency exchange, temperature scales, distance measurements, and unit conversions across metric and imperial systems.
Wayground's extensive library draws from millions of teacher-created resources, offering educators powerful search and filtering capabilities to locate conversion graph materials that align with specific curriculum standards and learning objectives. The platform's differentiation tools enable teachers to customize worksheets based on individual student needs, whether for remediation support or enrichment challenges. These resources are available in both printable and digital formats, including editable pdf versions that can be modified to match classroom requirements or integrated into existing lesson plans. The robust collection supports flexible instructional planning by providing varied problem types, difficulty levels, and contextual applications that help students master the connections between mathematical representations and practical measurement scenarios, ultimately building confidence in mathematical reasoning and problem-solving skills.
FAQs
How do I teach conversion graphs in Grade 8?
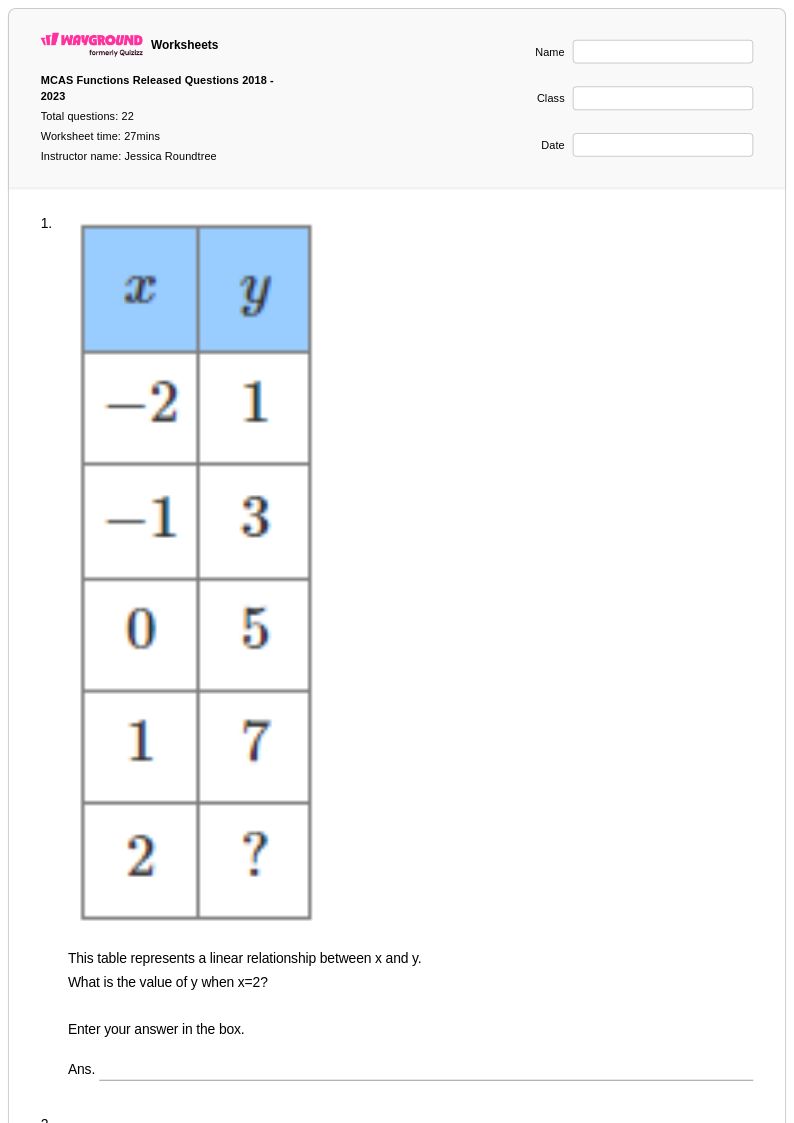
Connect each conversion graph to three equivalent representations: a value table, an equation, and a plotted line. Ask students to interpret the conversion factor as a rate of change, justify whether the relationship is proportional, and apply the model to currency, temperature, distance, and metric-imperial conversions.
What conversion graph exercises help Grade 8 students build fluency?
Grade 8 students benefit from plotting conversion data, calculating rates of change from two points, writing equations for conversion relationships, and estimating values through interpolation or extrapolation. Comparing graphs for currency exchange, temperature scales, and distance units also helps students distinguish proportional relationships from linear relationships with nonzero intercepts.
What errors should I look for when assessing Grade 8 conversion graphs?
Common errors include calculating change in the wrong order, using the reciprocal conversion factor, assuming every straight line passes through the origin, and overlooking a nonzero intercept in temperature conversions. Students may also report a coordinate without its units, so assessments should require an interpretation of both the rate of change and any starting value.
How can I use Grade 8 conversion graphs worksheets on Wayground?
Grade 8 conversion graphs worksheets are offered as printable PDFs and digital formats, enabling teachers to host a digital quiz on Wayground or assign a paper worksheet for guided instruction, independent work, or offline practice. Every worksheet includes a complete answer key, and the Wayground for Teachers app can scan or capture completed physical worksheets for grading.
How do Grade 8 conversion graphs align with Common Core math?
These worksheets align with Common Core's Grade 8 emphasis on functions, linear equations, slope, and comparing representations of quantitative relationships. Conversion graphs allow students to connect a rate of change with a table, graph, and equation while determining whether a real-world relationship is proportional or has an initial value.
How can I differentiate Grade 8 conversion graph practice?
Support developing learners with pre-drawn axes, selected coordinate points, and prompts that separate scale reading from rate calculations; challenge advanced learners with temperature graphs, reverse conversions, or comparisons of multiple linear models. Wayground offers extended time, Read Aloud, reduced answer choices, and reading mode, and teachers can adjust worksheet font size and spacing, use a dyslexia-friendly font, or translate the content.
Why do students study conversion graphs in Grade 8?
In Grade 8, conversion graphs provide a practical setting for studying slope, linear equations, and functions. Students move beyond simply performing a conversion to explaining how the rate of change and, when applicable, the intercept define the relationship between two measurement systems.